Labor & Logistics Indicators · October 2026
PMI 54.5, Warehouse Jobs −21,600: Retention Is the Peak Risk
Factories are expanding and costs are climbing, but warehouse jobs are falling and pay trails 3.4% inflation. Retention, not hiring, is the peak-season labor risk.
By Paul Baker, CFO · Published · Data as of Oct. 4, 2026
The Executive Soundbite
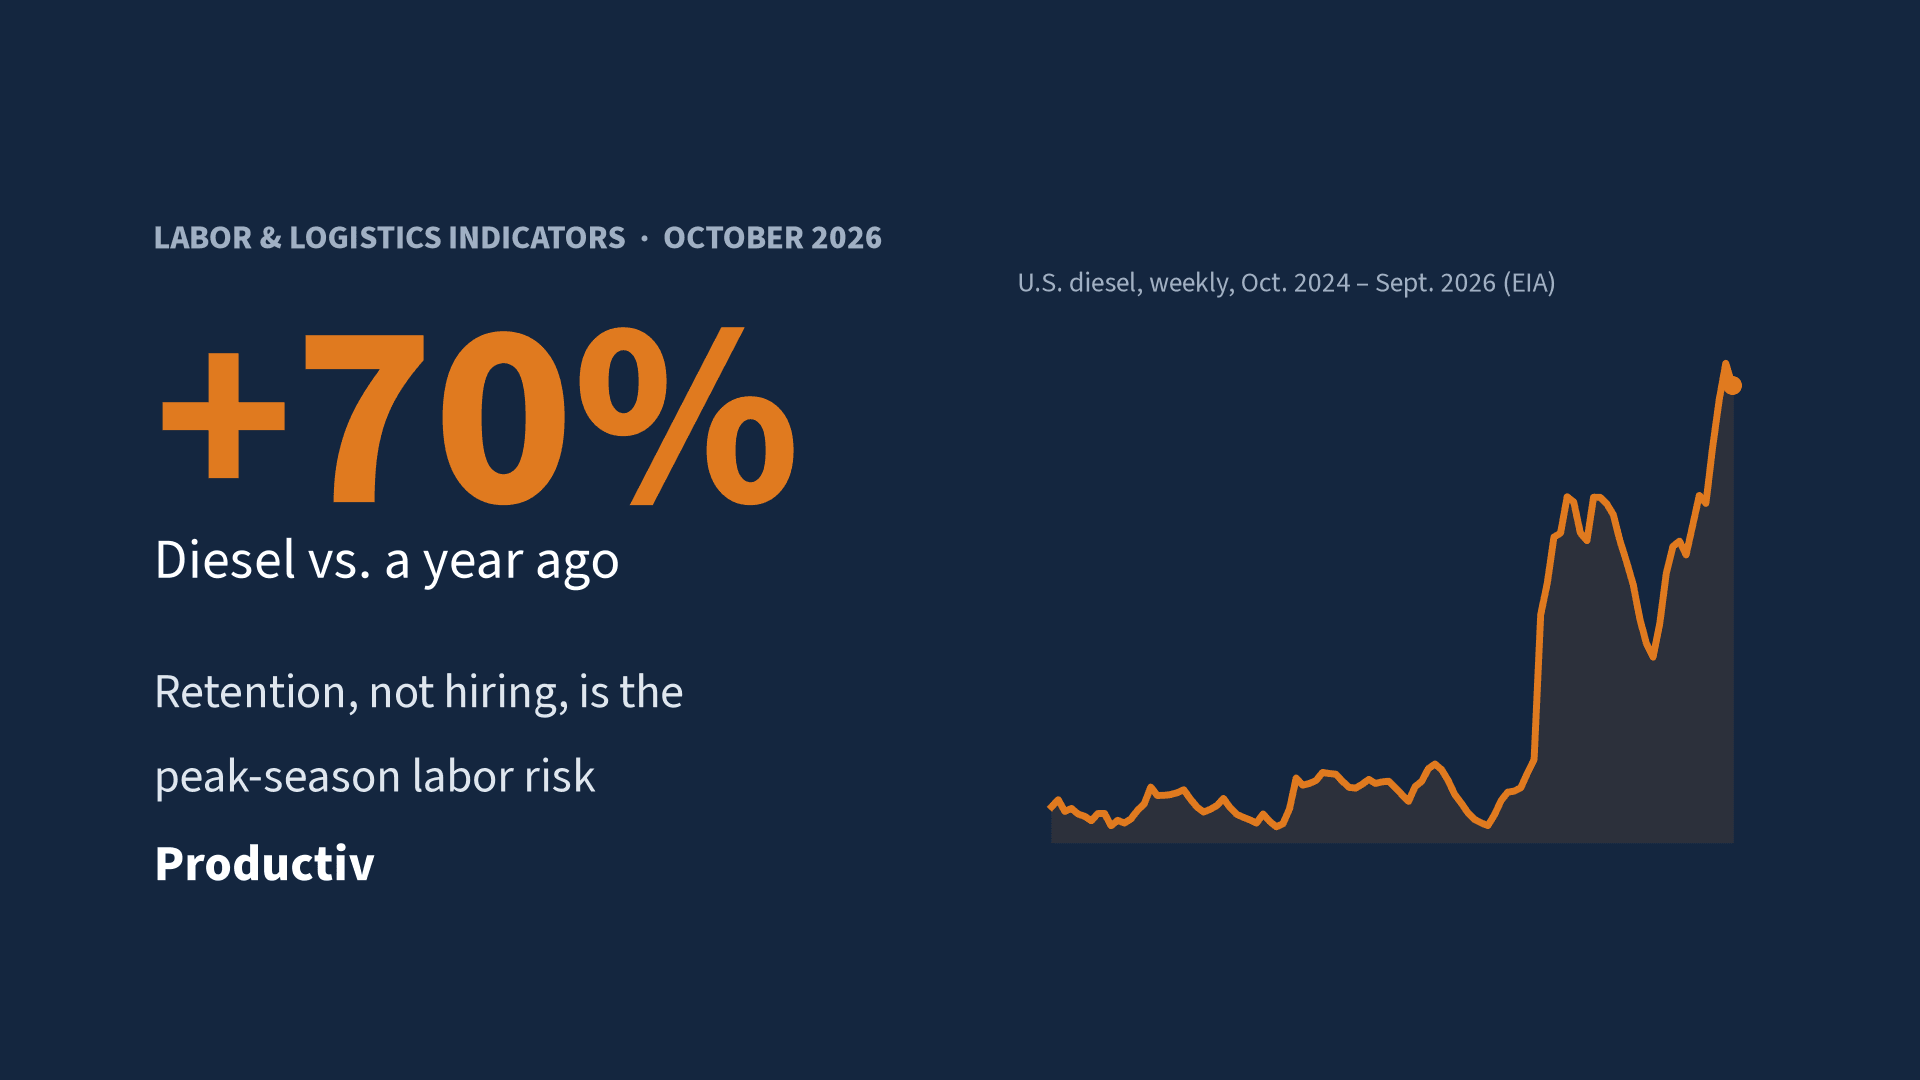
Manufacturing is expanding, with the ISM PMI at 54.5 in September. Meanwhile, warehousing and storage employment is down 21,600 from a year ago, and transportation and warehousing pay, up 3.1%, trails 3.4% inflation. Diesel at $6.382/gal and parcel ground fuel surcharges near 30% mean costs are moving faster than volume. Heading into peak, the labor risk is keeping trained people, not finding new ones.
“FedEx has already announced a 5.9% rate increase for January, and that comes on top of a ground fuel surcharge that's already 29.75%. Diesel is up about 70% from a year ago, and residential peak fees haven't even started. Freight spend is up 18.7% on just 2.1% more shipments, and diesel is the cost moving fastest.”
The Productiv Labor & Logistics Pressure Index
August 2026 (final)
130.4
+3.7 pts m/m · +14.9 pts y/y
- Labor
- 106.8
- Freight
- 128.6
- Capital & Inputs
- 143.7
How to read it: 100 = the 2015–2019 average; every 10 points is one normal-year swing; higher = more cost and labor pressure.
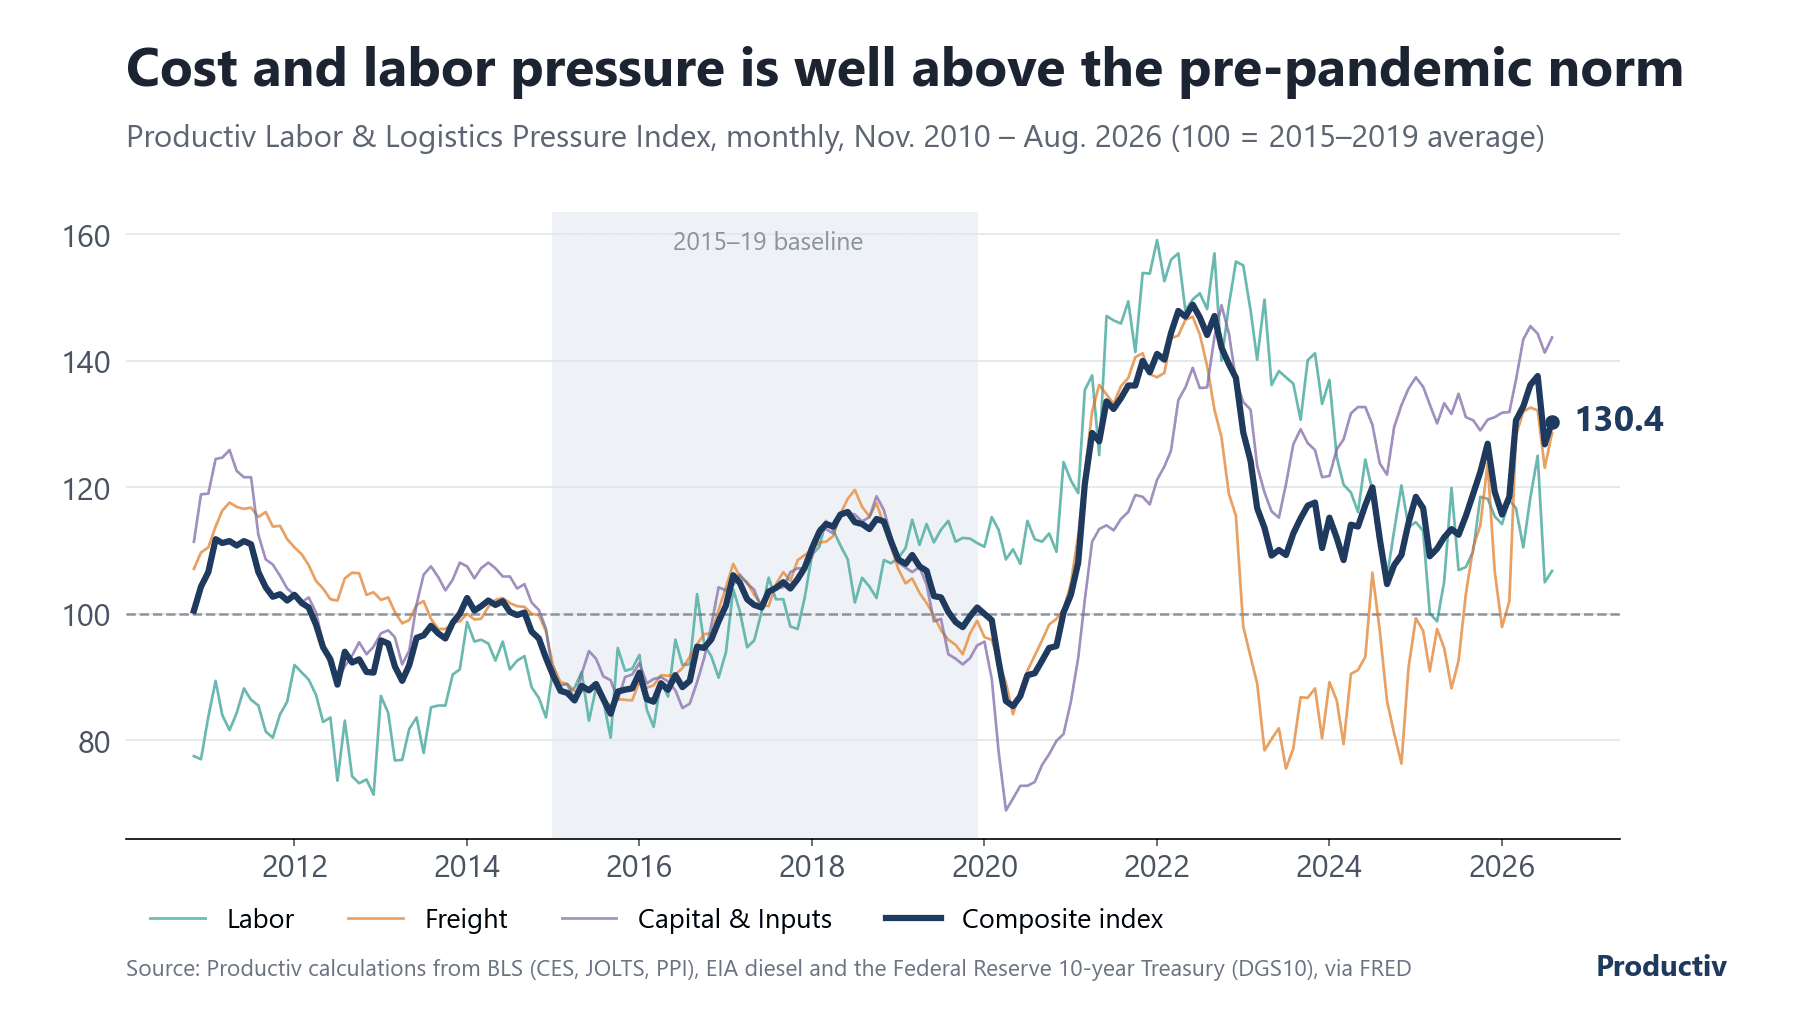
Chart data (table)
| Month | Index | Labor | Freight | Capital & Inputs |
|---|---|---|---|---|
| Sept. 2024 | 104.7 | 105.9 | 86.2 | 122.0 |
| Oct. 2024 | 107.7 | 113.1 | 81.1 | 129.5 |
| Nov. 2024 | 109.3 | 120.3 | 76.3 | 133.0 |
| Dec. 2024 | 114.4 | 113.7 | 91.5 | 135.6 |
| Jan. 2025 | 118.5 | 114.5 | 99.3 | 137.4 |
| Feb. 2025 | 116.7 | 113.1 | 97.3 | 135.9 |
| March 2025 | 109.1 | 100.1 | 90.9 | 133.1 |
| April 2025 | 110.3 | 98.8 | 97.6 | 130.1 |
| May 2025 | 112.1 | 105.1 | 94.6 | 133.3 |
| June 2025 | 113.4 | 119.9 | 88.2 | 131.6 |
| July 2025 | 112.5 | 106.9 | 92.6 | 134.8 |
| Aug. 2025 | 115.5 | 107.4 | 103.2 | 131.1 |
| Sept. 2025 | 119.0 | 109.9 | 110.5 | 130.6 |
| Oct. 2025 | 122.4 | 118.5 | 114.0 | 129.0 |
| Nov. 2025 | 126.9 | 118.2 | 123.8 | 130.7 |
| Dec. 2025 | 119.3 | 115.4 | 106.7 | 131.1 |
| Jan. 2026 | 115.7 | 114.2 | 97.9 | 131.8 |
| Feb. 2026 | 118.5 | 118.0 | 102.0 | 131.9 |
| March 2026 | 130.6 | 116.7 | 128.2 | 137.0 |
| April 2026 | 132.8 | 110.5 | 132.0 | 143.4 |
| May 2026 | 136.2 | 118.4 | 132.6 | 145.5 |
| June 2026 | 137.6 | 125.0 | 132.2 | 144.3 |
| July 2026 | 126.8 | 105.0 | 123.1 | 141.3 |
| Aug. 2026 | 130.4 | 106.8 | 128.6 | 143.7 |
Full monthly history since Nov. 2010, with each component's raw value, transform and z-score, is in the CSV.
Download CSV DataFor shippers & manufacturing leaders: At 130.4, pressure is about three normal-year swings above the pre-pandemic average, led by Capital & Inputs (143.7) and Freight (128.6). Set 2027 freight and packaging budgets against that, and ask your 3PL how its peak plan absorbs it.
For 3PLs & facility operators: Labor is the calmest pillar at 106.8, so the squeeze this month is fuel, freight and input costs, not wages. That makes now the cheaper time to lock in retention, before peak hiring competition starts.
How the index is built: components, weights, baseline and revision policy
At a glance
- Fuel: U.S. diesel averaged $6.382/gal for the week of Sept. 28, 2026, up $2.63 (about 70%) from a year earlier (EIA).
- Warehouse jobs: Warehousing and storage employment was 1,831,800 in September 2026 (preliminary), down 21,600 from a year earlier (BLS).
- Pay: Transportation and warehousing average hourly earnings were $32.78 in September 2026, up 3.1% year over year, behind August CPI inflation of 3.4% (BLS).
- Input prices: Producer prices for final demand rose 5.4% year over year in August 2026 (BLS), and the ISM manufacturing prices index was 77.9 in September (ISM).
- Parcel: Ground fuel surcharges were 30.25% at UPS and 29.75% at FedEx for the week of Sept. 28, 2026, before peak fees. FedEx's 2027 rate increase averages 5.9% (carrier notices).
1. Economy
- Real GDP: +2.2% annualized in Q2 2026 (BEA third estimate, released Sept. 30). Q1 was revised to +2.5%.
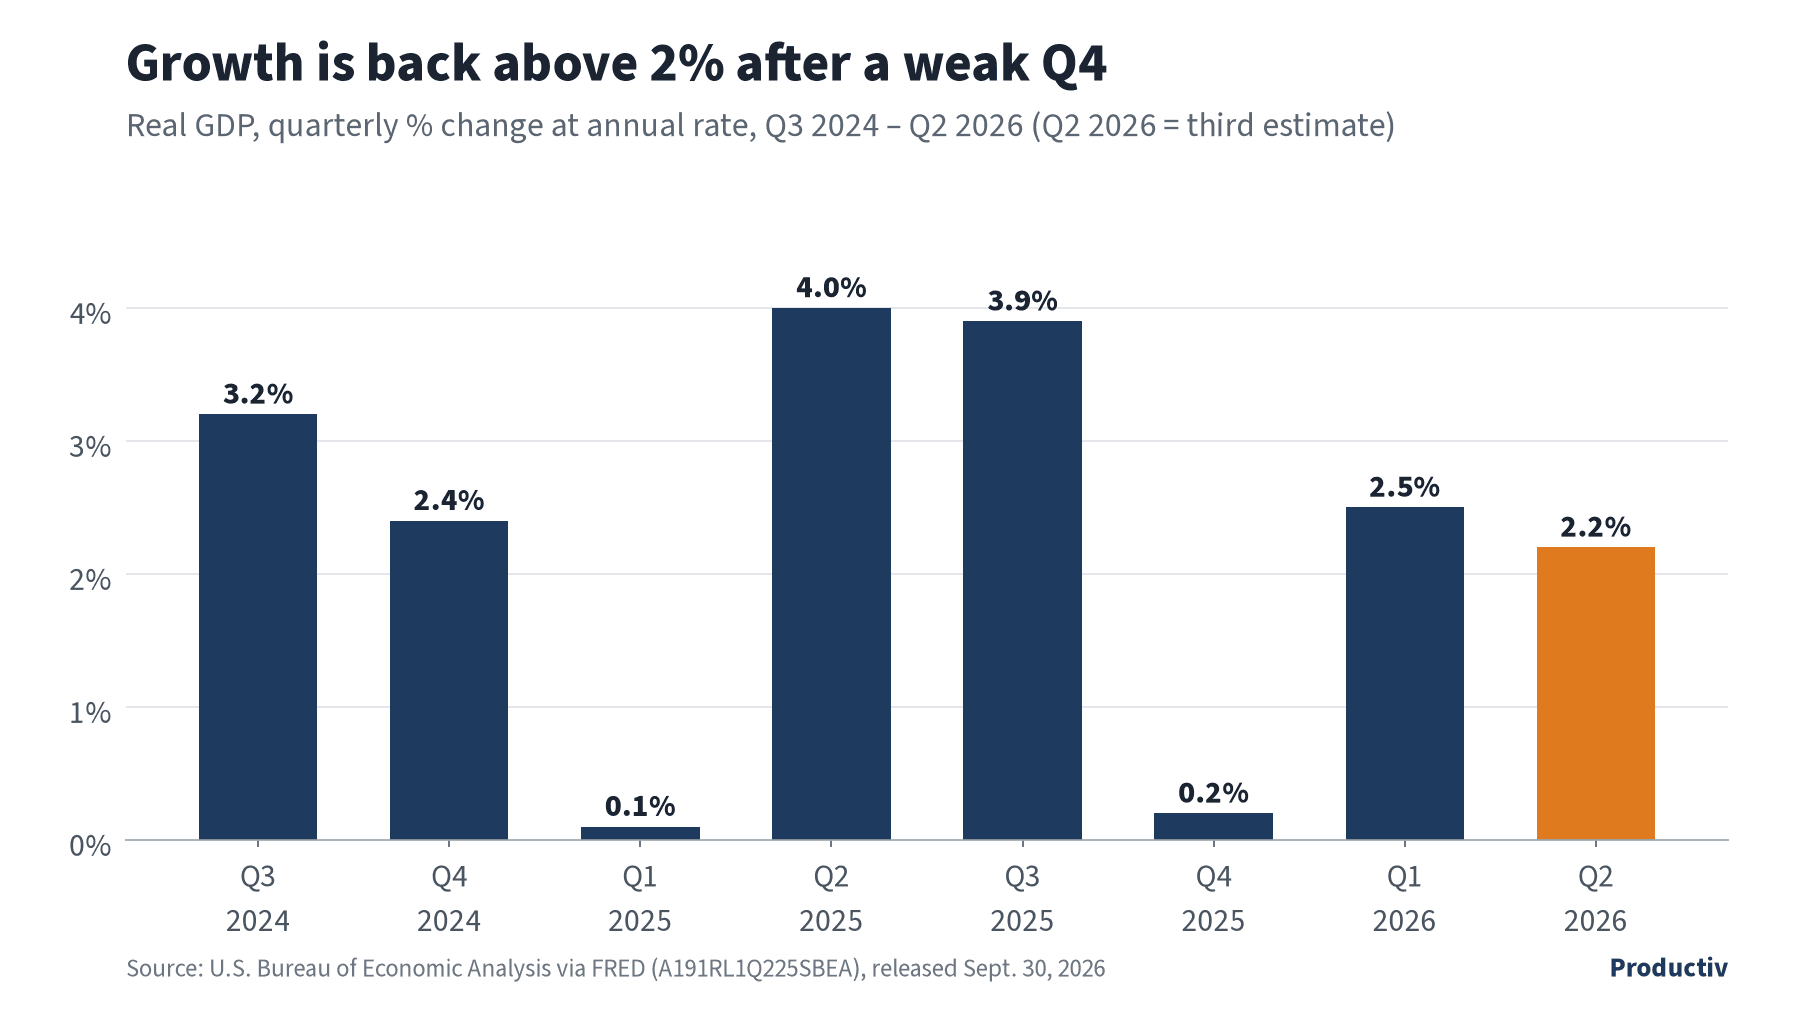
Chart data (table)
| Quarter | Real GDP growth |
|---|---|
| Q3 2024 | 3.2% |
| Q4 2024 | 2.4% |
| Q1 2025 | 0.1% |
| Q2 2025 | 4.0% |
| Q3 2025 | 3.9% |
| Q4 2025 | 0.2% |
| Q1 2026 | 2.5% |
| Q2 2026 | 2.2% |
Q2 2026 is the BEA third estimate (released Sept. 30, 2026).
Download CSV Data- CPI, headline: +3.4% year over year in August 2026 (BLS, released Sept. 11).
- CPI, core (excluding food and energy): +2.4% year over year. Energy was up 16.3% and gasoline up 27.4%. Transportation services were up 2.4%.
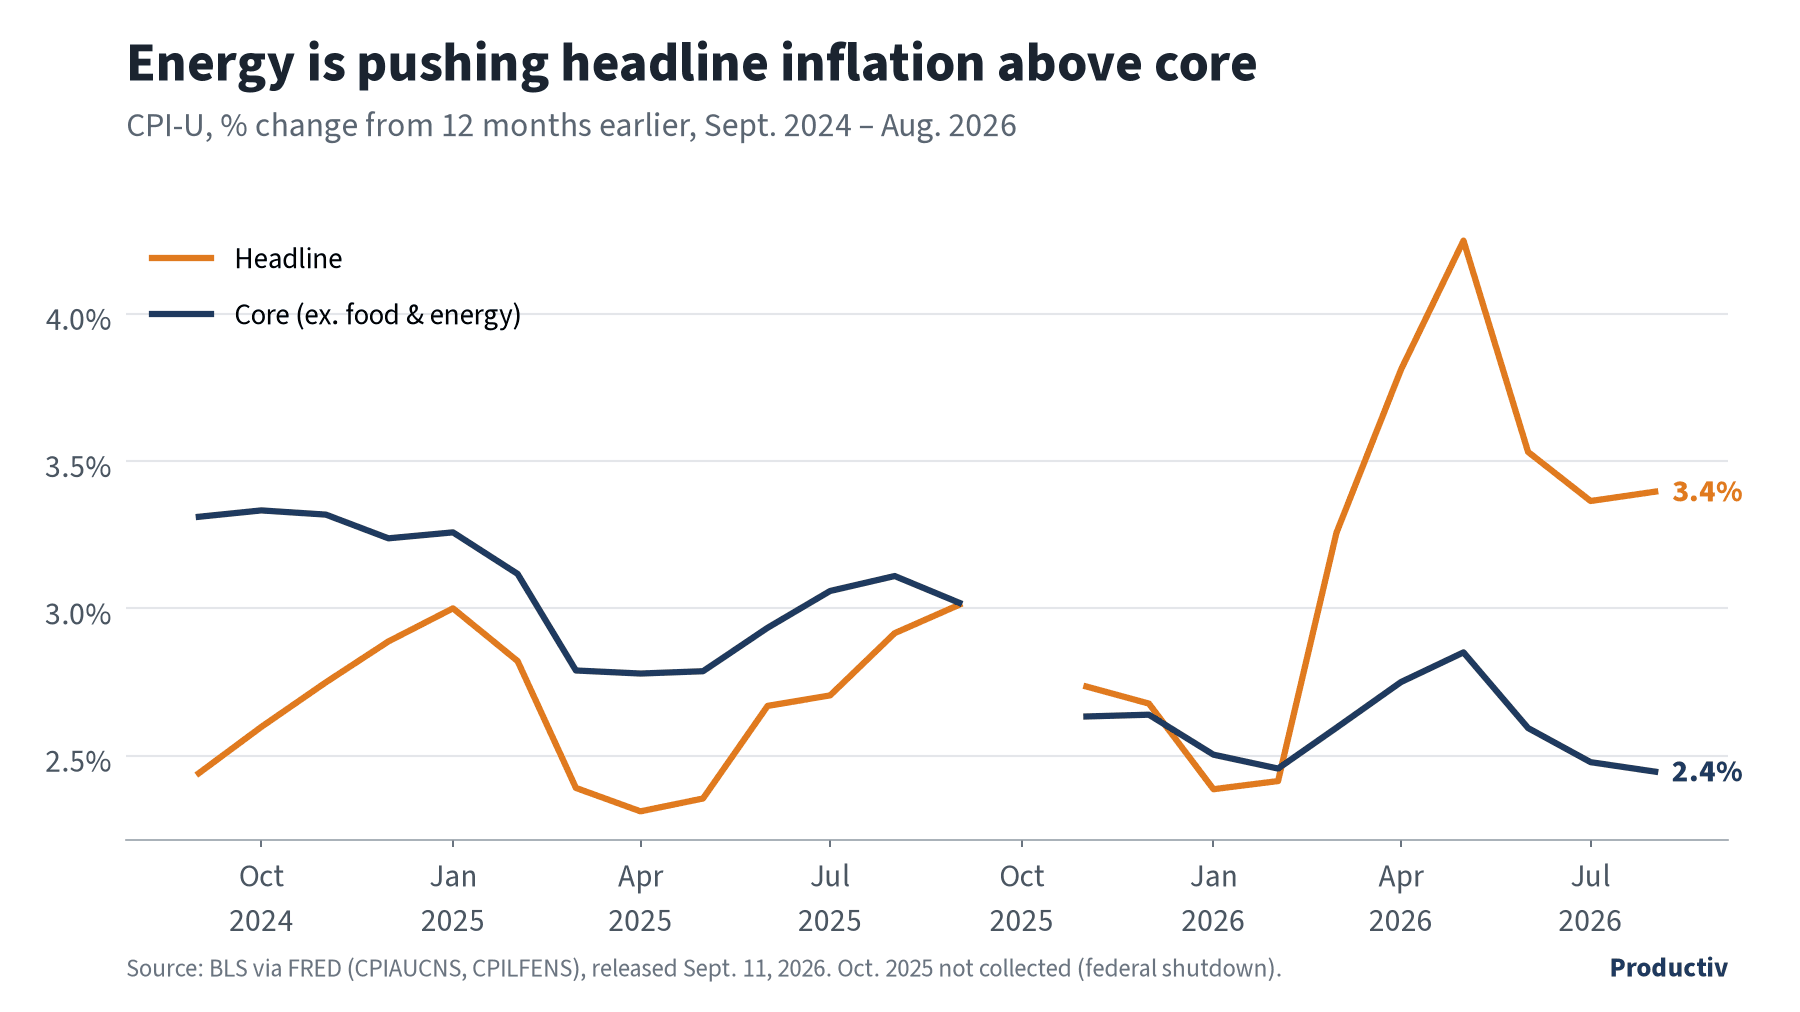
Chart data (table)
| Month | Headline CPI | Core CPI (ex. food & energy) |
|---|---|---|
| Sept. 2024 | 2.4% | 3.3% |
| Oct. 2024 | 2.6% | 3.3% |
| Nov. 2024 | 2.7% | 3.3% |
| Dec. 2024 | 2.9% | 3.2% |
| Jan. 2025 | 3.0% | 3.3% |
| Feb. 2025 | 2.8% | 3.1% |
| March 2025 | 2.4% | 2.8% |
| April 2025 | 2.3% | 2.8% |
| May 2025 | 2.4% | 2.8% |
| June 2025 | 2.7% | 2.9% |
| July 2025 | 2.7% | 3.1% |
| Aug. 2025 | 2.9% | 3.1% |
| Sept. 2025 | 3.0% | 3.0% |
| Oct. 2025 | n/a | n/a |
| Nov. 2025 | 2.7% | 2.6% |
| Dec. 2025 | 2.7% | 2.6% |
| Jan. 2026 | 2.4% | 2.5% |
| Feb. 2026 | 2.4% | 2.5% |
| March 2026 | 3.3% | 2.6% |
| April 2026 | 3.8% | 2.8% |
| May 2026 | 4.2% | 2.9% |
| June 2026 | 3.5% | 2.6% |
| July 2026 | 3.4% | 2.5% |
| Aug. 2026 | 3.4% | 2.4% |
n/a: October 2025 CPI was not collected (federal shutdown).
Download CSV Data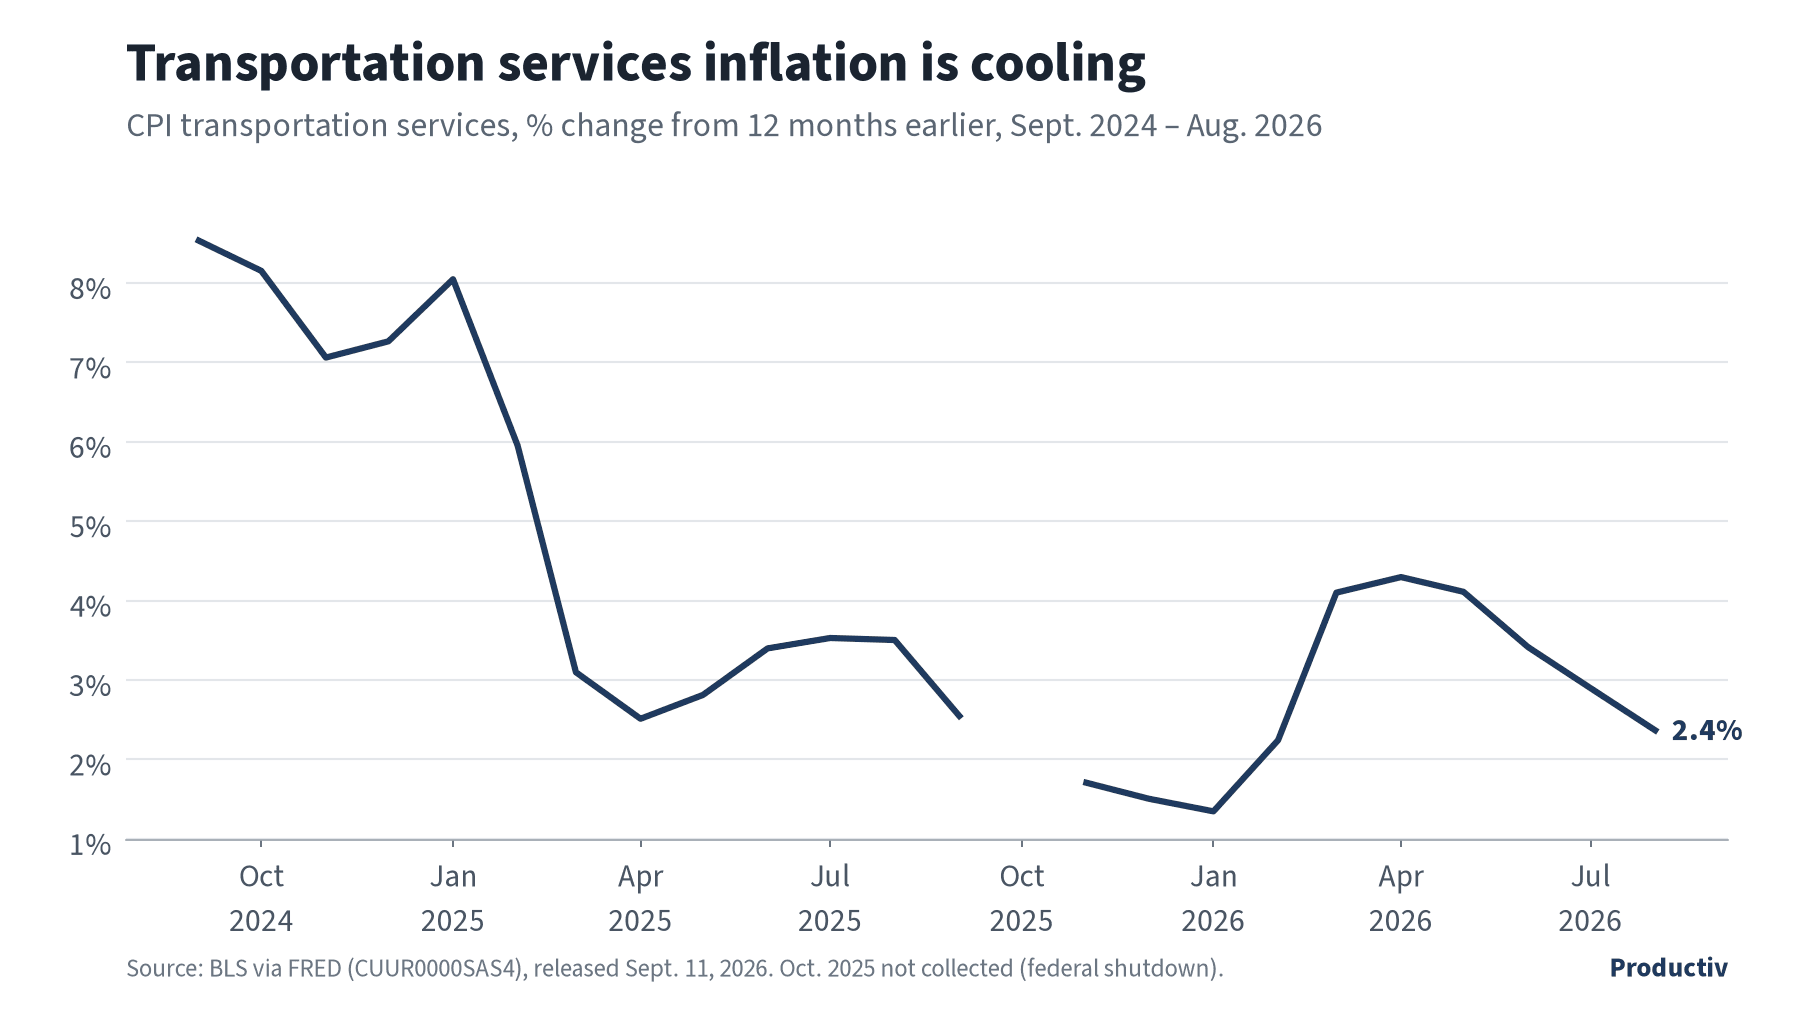
Chart data (table)
| Month | Transportation services CPI |
|---|---|
| Sept. 2024 | 8.5% |
| Oct. 2024 | 8.2% |
| Nov. 2024 | 7.1% |
| Dec. 2024 | 7.3% |
| Jan. 2025 | 8.0% |
| Feb. 2025 | 6.0% |
| March 2025 | 3.1% |
| April 2025 | 2.5% |
| May 2025 | 2.8% |
| June 2025 | 3.4% |
| July 2025 | 3.5% |
| Aug. 2025 | 3.5% |
| Sept. 2025 | 2.5% |
| Oct. 2025 | n/a |
| Nov. 2025 | 1.7% |
| Dec. 2025 | 1.5% |
| Jan. 2026 | 1.3% |
| Feb. 2026 | 2.2% |
| March 2026 | 4.1% |
| April 2026 | 4.3% |
| May 2026 | 4.1% |
| June 2026 | 3.4% |
| July 2026 | 2.9% |
| Aug. 2026 | 2.4% |
n/a: October 2025 CPI was not collected (federal shutdown).
Download CSV Data- Producer Price Index, final demand: +0.4% month over month and +5.4% year over year in August 2026 (BLS, released Sept. 10).
- PPI core (excluding foods, energy, and trade services): +0.3% month over month and +4.7% year over year.
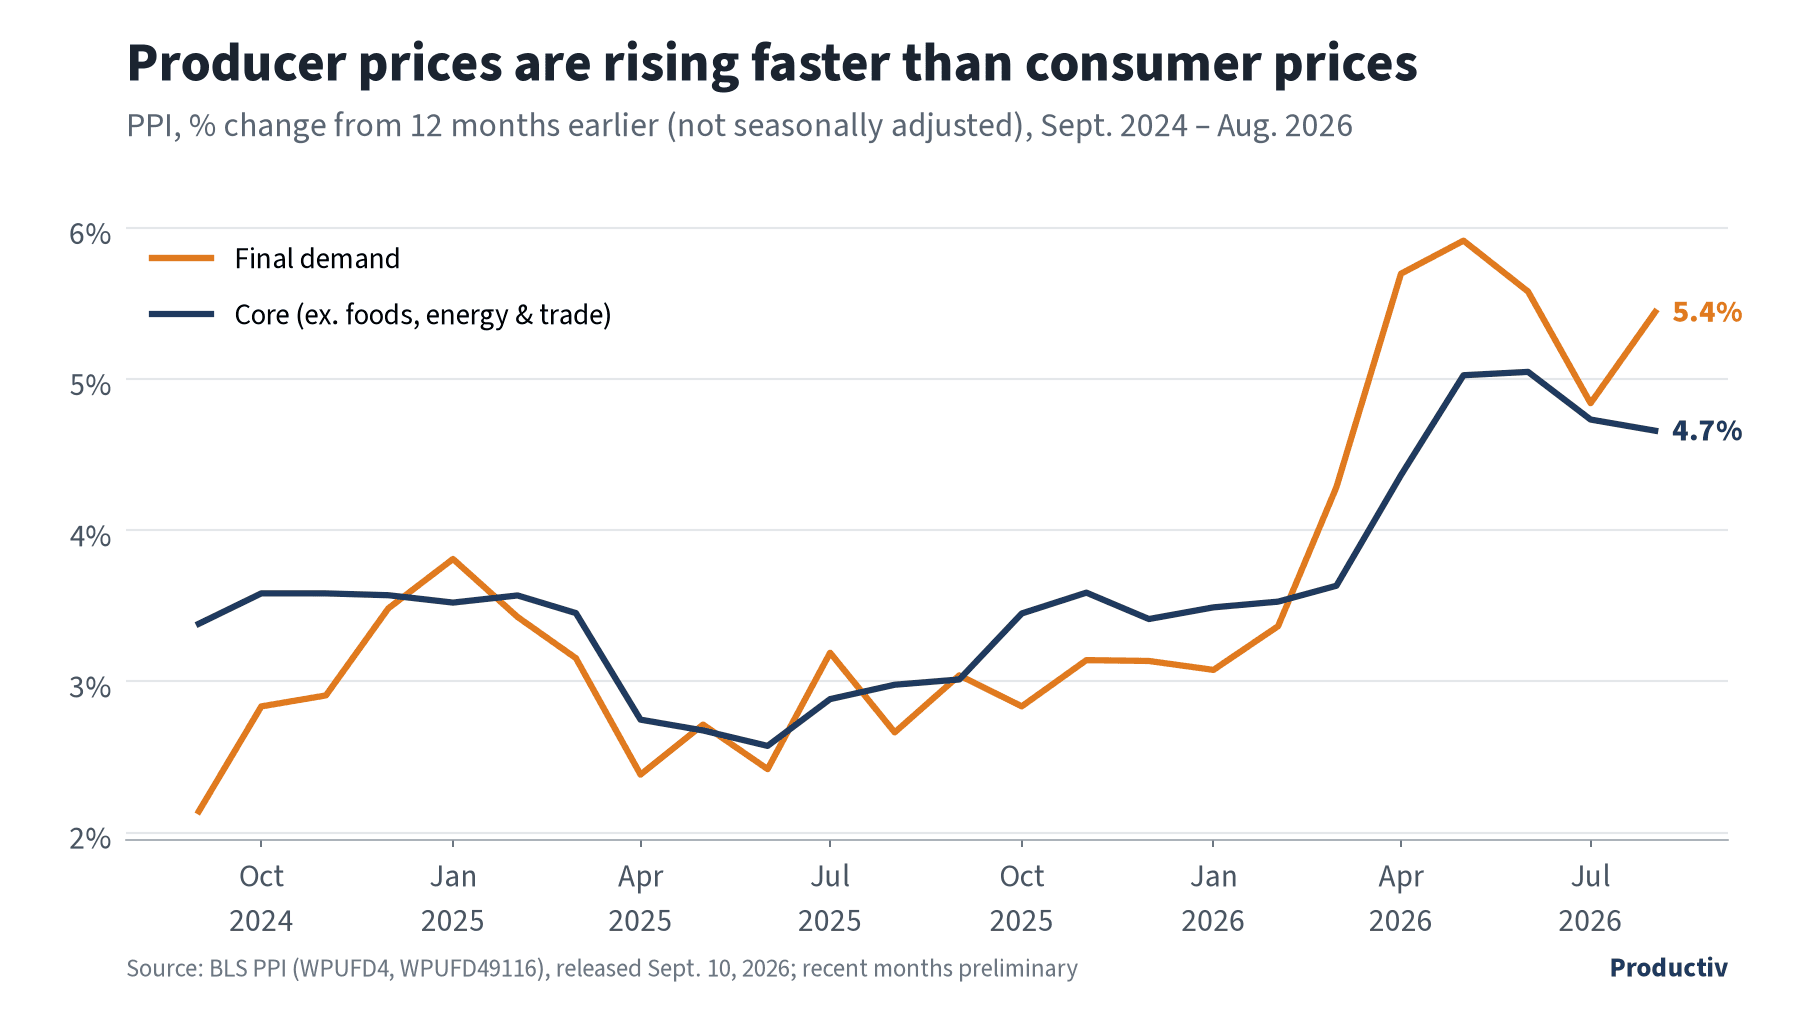
Chart data (table)
| Month | Final demand | Core (ex. foods, energy & trade services) |
|---|---|---|
| Sept. 2024 | 2.1% | 3.4% |
| Oct. 2024 | 2.8% | 3.6% |
| Nov. 2024 | 2.9% | 3.6% |
| Dec. 2024 | 3.5% | 3.6% |
| Jan. 2025 | 3.8% | 3.5% |
| Feb. 2025 | 3.4% | 3.6% |
| March 2025 | 3.2% | 3.5% |
| April 2025 | 2.4% | 2.7% |
| May 2025 | 2.7% | 2.7% |
| June 2025 | 2.4% | 2.6% |
| July 2025 | 3.2% | 2.9% |
| Aug. 2025 | 2.7% | 3.0% |
| Sept. 2025 | 3.0% | 3.0% |
| Oct. 2025 | 2.8% | 3.5% |
| Nov. 2025 | 3.1% | 3.6% |
| Dec. 2025 | 3.1% | 3.4% |
| Jan. 2026 | 3.1% | 3.5% |
| Feb. 2026 | 3.4% | 3.5% |
| March 2026 | 4.3% | 3.6% |
| April 2026 | 5.7% | 4.4% |
| May 2026 | 5.9% | 5.0% |
| June 2026 | 5.6% | 5.0% |
| July 2026 | 4.8% | 4.7% |
| Aug. 2026 | 5.4% | 4.7% |
Recent months are preliminary.
Download CSV Data- ISM Manufacturing PMI: 54.5 in September 2026, down from 54.6 in August (ISM, released Oct. 1). That's the ninth straight month of expansion (above 50 = growth).
- New orders: 55.3 (+1.6)
- Employment: 52.7 (+1.5)
- Prices: 77.9 (+6.8), close to March's 78.3
- Industrial production, manufacturing: +1.0% year over year in August 2026 (Federal Reserve G.17; FRED updated Sept. 18).
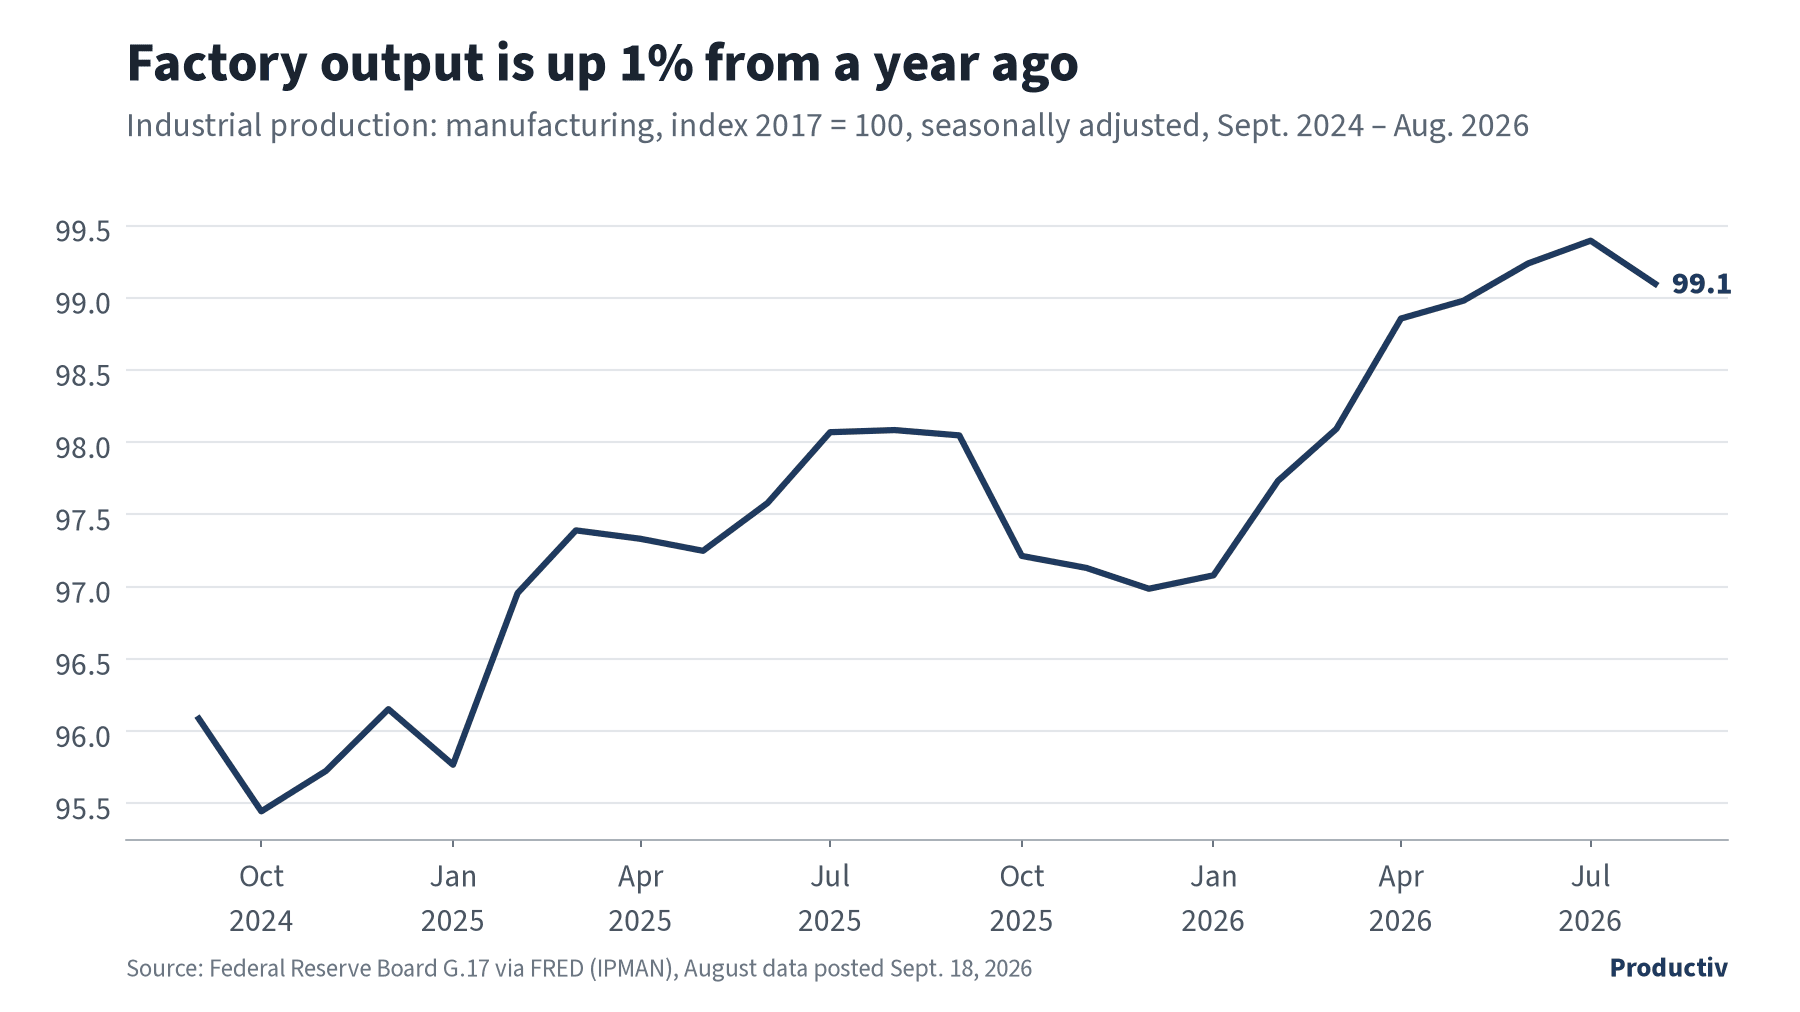
Chart data (table)
| Month | Index |
|---|---|
| Sept. 2024 | 96.1 |
| Oct. 2024 | 95.4 |
| Nov. 2024 | 95.7 |
| Dec. 2024 | 96.2 |
| Jan. 2025 | 95.8 |
| Feb. 2025 | 97.0 |
| March 2025 | 97.4 |
| April 2025 | 97.3 |
| May 2025 | 97.2 |
| June 2025 | 97.6 |
| July 2025 | 98.1 |
| Aug. 2025 | 98.1 |
| Sept. 2025 | 98.0 |
| Oct. 2025 | 97.2 |
| Nov. 2025 | 97.1 |
| Dec. 2025 | 97.0 |
| Jan. 2026 | 97.1 |
| Feb. 2026 | 97.7 |
| March 2026 | 98.1 |
| April 2026 | 98.9 |
| May 2026 | 99.0 |
| June 2026 | 99.2 |
| July 2026 | 99.4 |
| Aug. 2026 | 99.1 |
- E-commerce share of retail: 17.1% in Q2 2026, up from 16.3% a year earlier (Census Bureau, released Aug. 18).
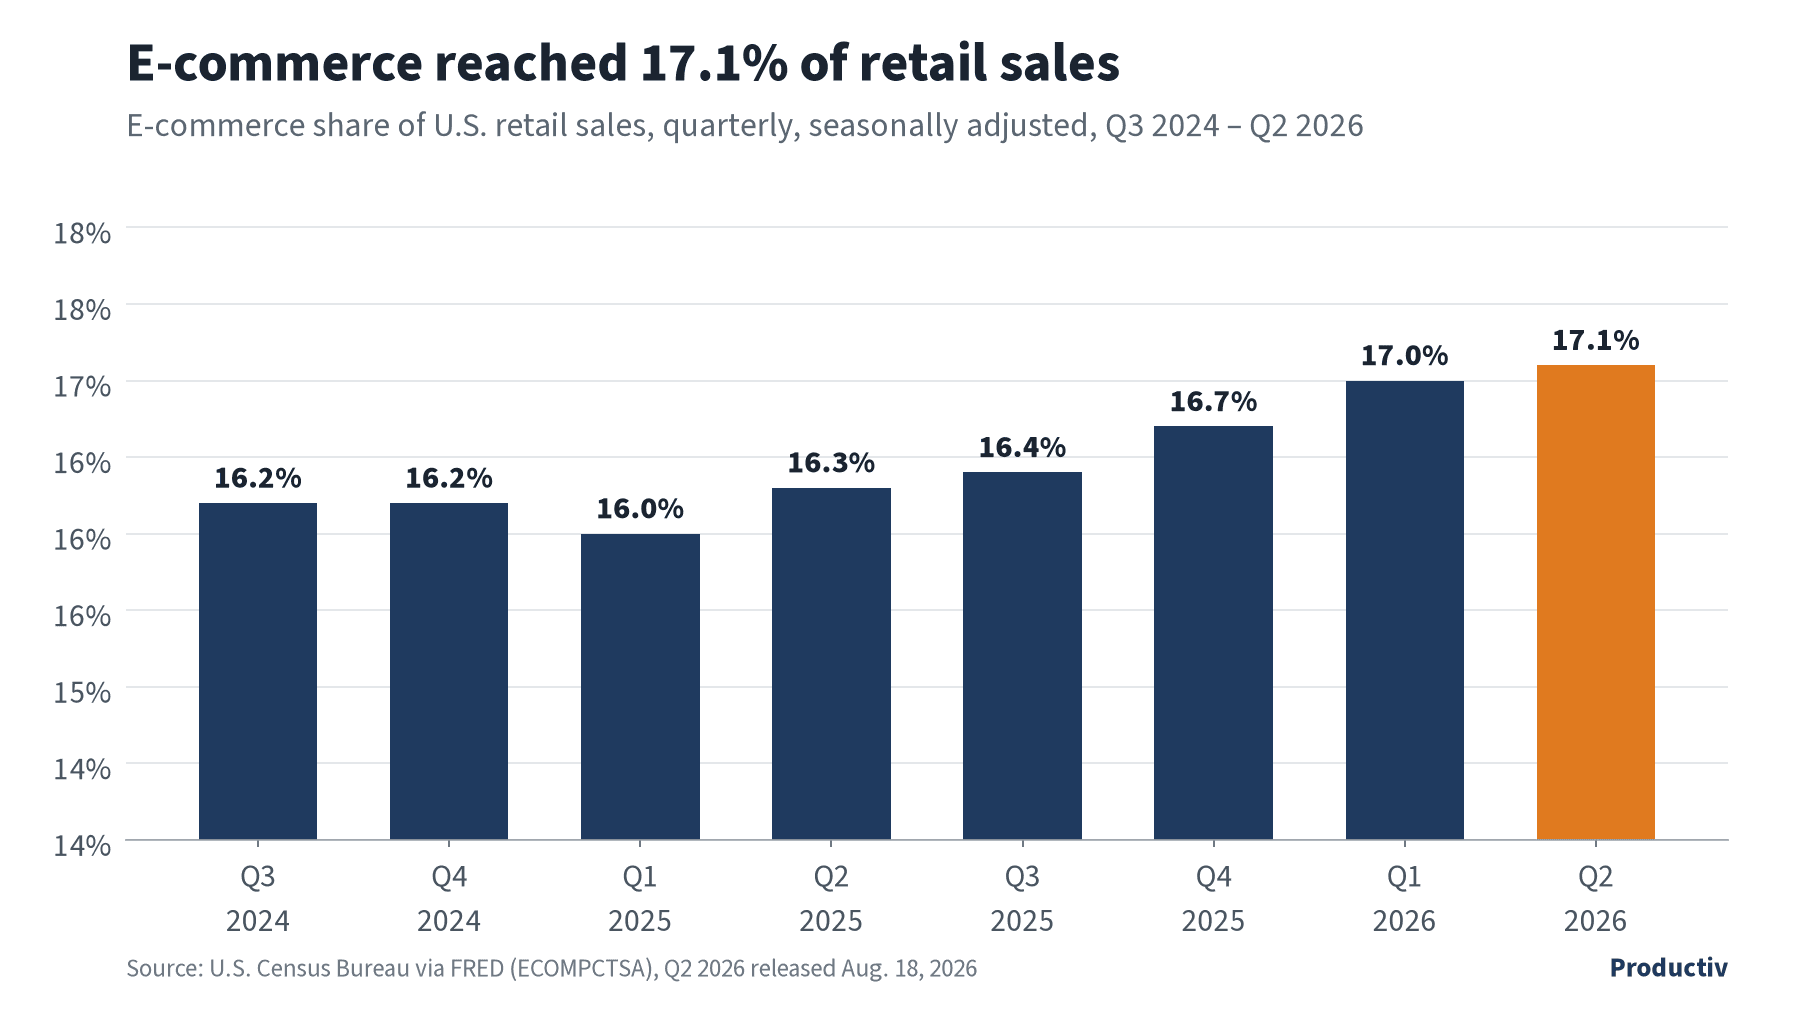
Chart data (table)
| Quarter | E-commerce share |
|---|---|
| Q3 2024 | 16.2% |
| Q4 2024 | 16.2% |
| Q1 2025 | 16.0% |
| Q2 2025 | 16.3% |
| Q3 2025 | 16.4% |
| Q4 2025 | 16.7% |
| Q1 2026 | 17.0% |
| Q2 2026 | 17.1% |
What it means
- Shippers & manufacturers
- Producer prices are up 5.4% year over year (August) and the ISM prices index is 77.9 (September). Expect component and packaging quotes to rise before your selling prices do, and set 2027 cost assumptions now.
- 3PLs & warehouse operators
- Core PPI is up 4.7%, so supply bills keep climbing. Check the pass-through terms in your contracts before peak volume arrives.
- Transportation & fleets
- Manufacturing output is up 1.0% year over year (August) and new orders are at 55.3, so industrial freight demand is growing, slowly.
Sources: BEA GDP, BLS CPI August 2026, BLS PPI August 2026, ISM Manufacturing PMI, September 2026, Federal Reserve G.17 via FRED, Census quarterly e-commerce
2. Credit & Rates
- Fed funds target range: 3.75%–4.00%, after a 0.25-point increase at the Sept. 15–16 FOMC meeting (statement released Sept. 16). The next meeting is Oct. 27–28.
- Effective fed funds rate: 3.88% on Oct. 1, compared with 4.09% a year ago.
- 30-year fixed mortgage (Freddie Mac PMMS): 7.28% for the week of Oct. 1, up from 6.34% a year ago.
- 10-year Treasury: 5.24% on Oct. 1, up from 4.12% a year ago.
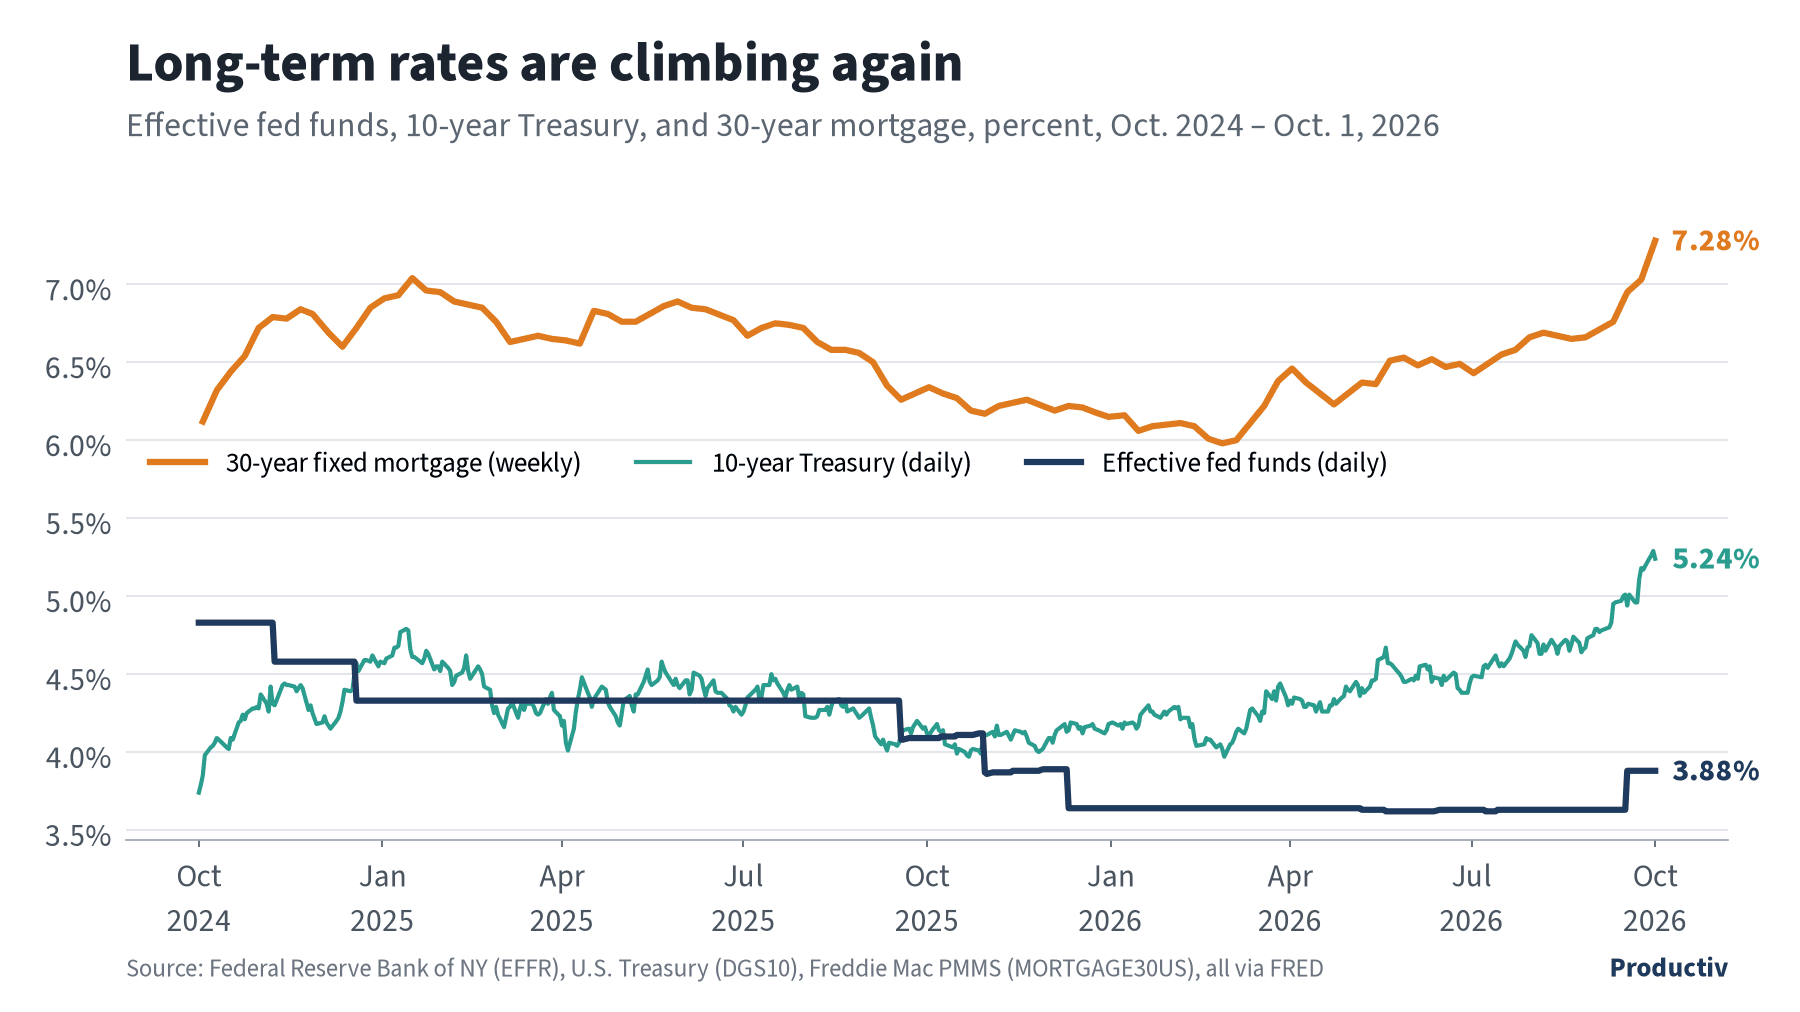
Chart data (table)
| Month | Effective fed funds | 10-year Treasury | 30-year fixed mortgage |
|---|---|---|---|
| Oct. 2024 | 4.83% | 4.28% | 6.72% |
| Nov. 2024 | 4.58% | 4.18% | 6.81% |
| Dec. 2024 | 4.33% | 4.58% | 6.85% |
| Jan. 2025 | 4.33% | 4.58% | 6.95% |
| Feb. 2025 | 4.33% | 4.24% | 6.76% |
| March 2025 | 4.33% | 4.23% | 6.65% |
| April 2025 | 4.33% | 4.17% | 6.81% |
| May 2025 | 4.33% | 4.41% | 6.89% |
| June 2025 | 4.33% | 4.24% | 6.77% |
| July 2025 | 4.33% | 4.37% | 6.72% |
| Aug. 2025 | 4.33% | 4.23% | 6.56% |
| Sept. 2025 | 4.09% | 4.16% | 6.30% |
| Oct. 2025 | 3.86% | 4.11% | 6.17% |
| Nov. 2025 | 3.89% | 4.02% | 6.23% |
| Dec. 2025 | 3.64% | 4.18% | 6.15% |
| Jan. 2026 | 3.64% | 4.26% | 6.10% |
| Feb. 2026 | 3.64% | 3.97% | 5.98% |
| March 2026 | 3.64% | 4.30% | 6.38% |
| April 2026 | 3.64% | 4.40% | 6.30% |
| May 2026 | 3.62% | 4.45% | 6.53% |
| June 2026 | 3.63% | 4.44% | 6.49% |
| July 2026 | 3.63% | 4.75% | 6.66% |
| Aug. 2026 | 3.63% | 4.75% | 6.66% |
| Sept. 2026 | 3.88% | 5.29% | 7.03% |
| Oct. 2026 (Oct. 1) | 3.88% | 5.24% | 7.28% |
Each cell is the last published value in that month; the download has every daily and weekly reading.
Download CSV Data- Bank prime loan rate: 7.00%, up from 6.75% before the September hike (7.25% a year ago).
What it means
- Shippers & manufacturers
- The 10-year Treasury is 5.24% (Oct. 1), up from 4.12% a year ago, so carrying peak inventory costs more. Tighter replenishment beats early, deep stock positions.
- 3PLs & warehouse operators
- With the bank prime rate at 7.00%, automation and equipment projects need a shorter payback to clear the bar. Higher rates also slow new warehouse development, which supports rents.
- Transportation & fleets
- Financing tractors and trailers costs more at a 7.00% prime rate. Extending the life of current equipment is worth pricing against replacement.
Sources: Federal Reserve FOMC statement, Sept. 16, 2026, FOMC calendar, FRED: EFFR, MORTGAGE30US, DGS10, DPRIME
3. Labor
- Transportation & warehousing employment: 6,608,700 in September (preliminary). That's +7,600 from August and about 9,800 below September 2025.
- Warehousing & storage: 1,831,800, down 4,100 from August and 21,600 from a year ago.
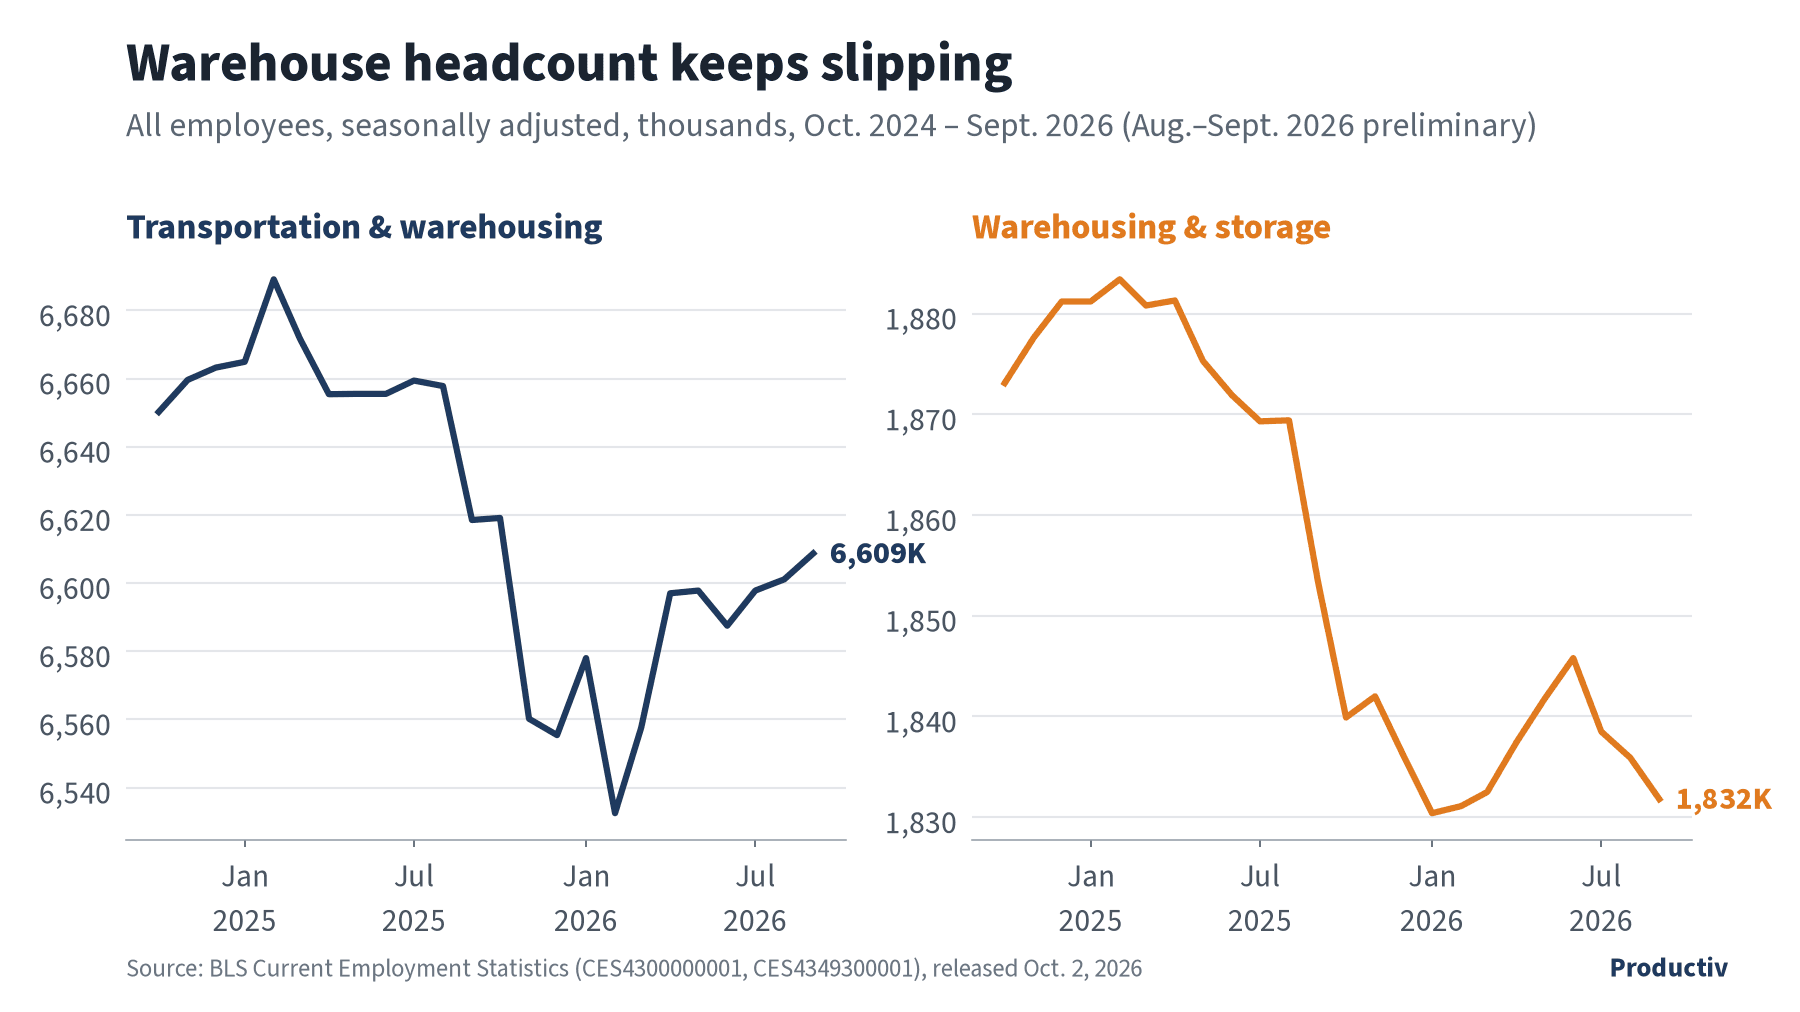
Chart data (table)
| Month | Transportation & warehousing | Warehousing & storage |
|---|---|---|
| Oct. 2024 | 6,650.2 | 1,873.1 |
| Nov. 2024 | 6,659.6 | 1,877.6 |
| Dec. 2024 | 6,663.2 | 1,881.2 |
| Jan. 2025 | 6,664.9 | 1,881.2 |
| Feb. 2025 | 6,689.1 | 1,883.4 |
| March 2025 | 6,671.7 | 1,880.8 |
| April 2025 | 6,655.4 | 1,881.3 |
| May 2025 | 6,655.5 | 1,875.3 |
| June 2025 | 6,655.5 | 1,871.9 |
| July 2025 | 6,659.4 | 1,869.3 |
| Aug. 2025 | 6,657.8 | 1,869.4 |
| Sept. 2025 | 6,618.5 | 1,853.4 |
| Oct. 2025 | 6,619.1 | 1,839.9 |
| Nov. 2025 | 6,560.2 | 1,842.0 |
| Dec. 2025 | 6,555.4 | 1,836.2 |
| Jan. 2026 | 6,578.0 | 1,830.4 |
| Feb. 2026 | 6,532.5 | 1,831.1 |
| March 2026 | 6,557.6 | 1,832.5 |
| April 2026 | 6,597.0 | 1,837.4 |
| May 2026 | 6,597.8 | 1,841.7 |
| June 2026 | 6,587.5 | 1,845.8 |
| July 2026 | 6,597.8 | 1,838.5 |
| Aug. 2026 | 6,601.1 | 1,835.9 |
| Sept. 2026 | 6,608.7 | 1,831.8 |
Aug.–Sept. 2026 are preliminary.
Download CSV Data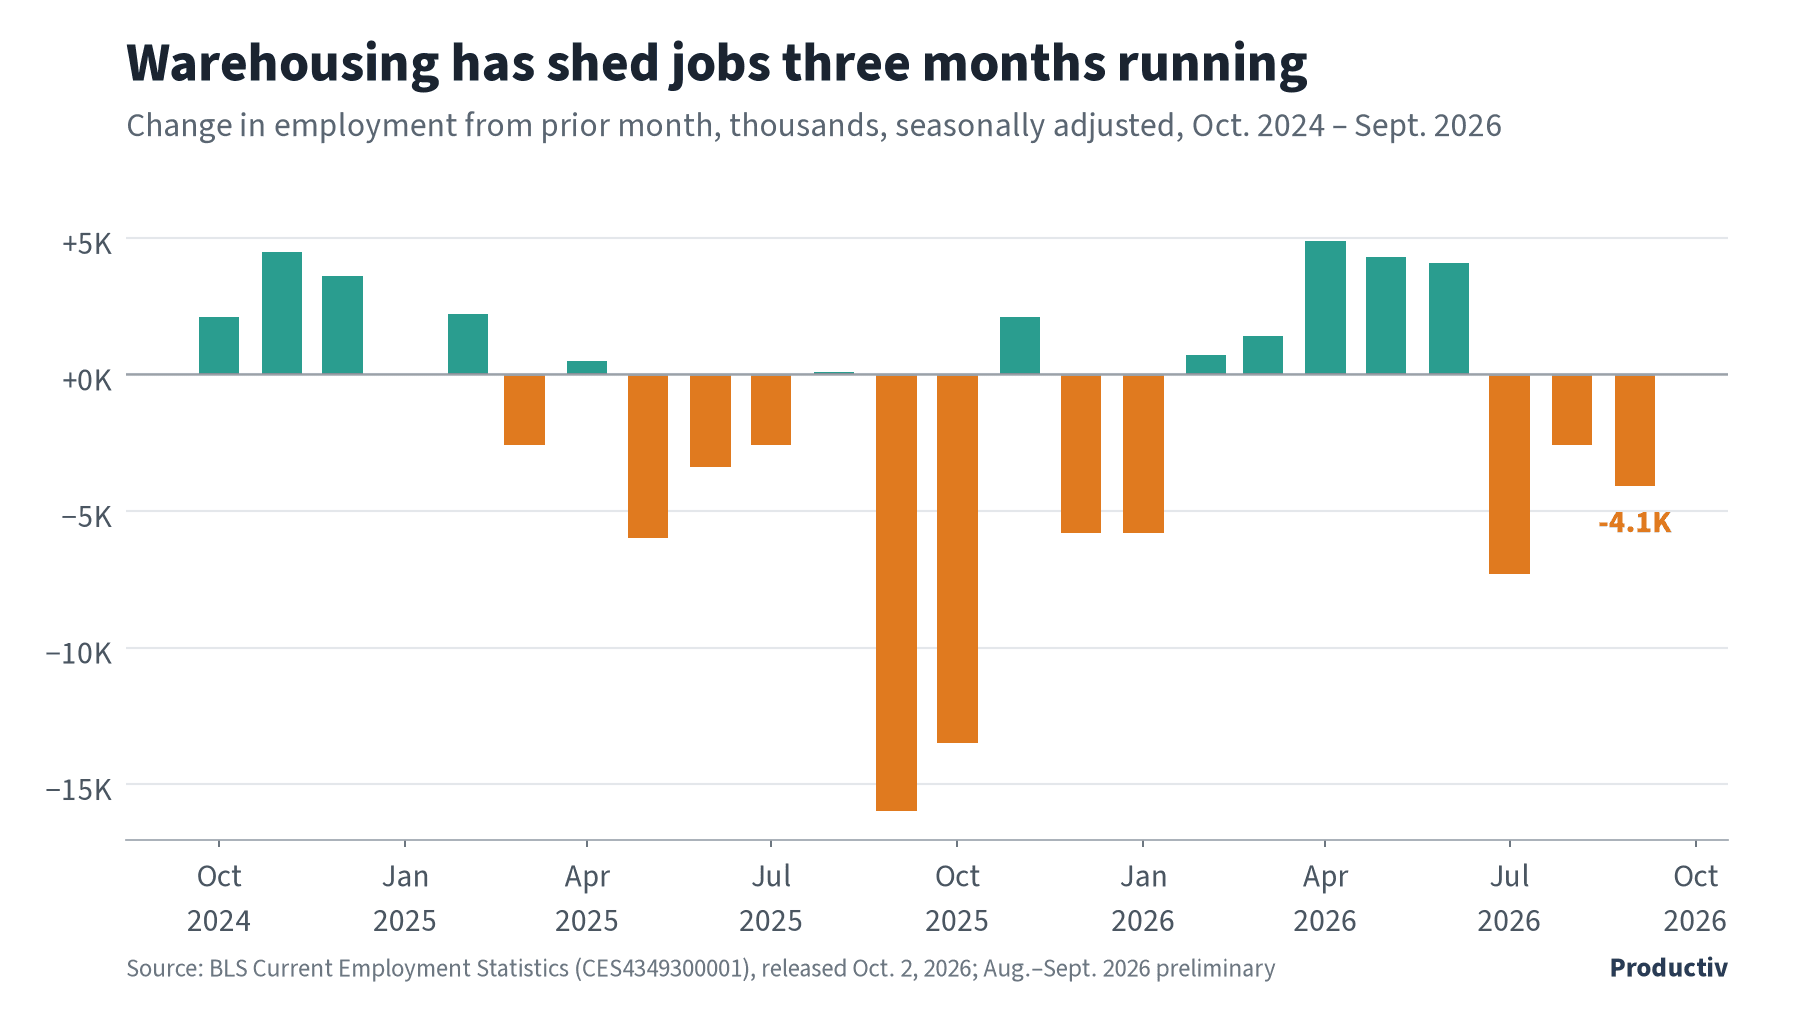
Chart data (table)
| Month | Change (thousands) |
|---|---|
| Oct. 2024 | +2.1 |
| Nov. 2024 | +4.5 |
| Dec. 2024 | +3.6 |
| Jan. 2025 | +0.0 |
| Feb. 2025 | +2.2 |
| March 2025 | -2.6 |
| April 2025 | +0.5 |
| May 2025 | -6.0 |
| June 2025 | -3.4 |
| July 2025 | -2.6 |
| Aug. 2025 | +0.1 |
| Sept. 2025 | -16.0 |
| Oct. 2025 | -13.5 |
| Nov. 2025 | +2.1 |
| Dec. 2025 | -5.8 |
| Jan. 2026 | -5.8 |
| Feb. 2026 | +0.7 |
| March 2026 | +1.4 |
| April 2026 | +4.9 |
| May 2026 | +4.3 |
| June 2026 | +4.1 |
| July 2026 | -7.3 |
| Aug. 2026 | -2.6 |
| Sept. 2026 | -4.1 |
Aug.–Sept. 2026 are preliminary.
Download CSV Data- Average hourly earnings, transportation & warehousing: $32.78, up $0.08 from August and +3.1% year over year.
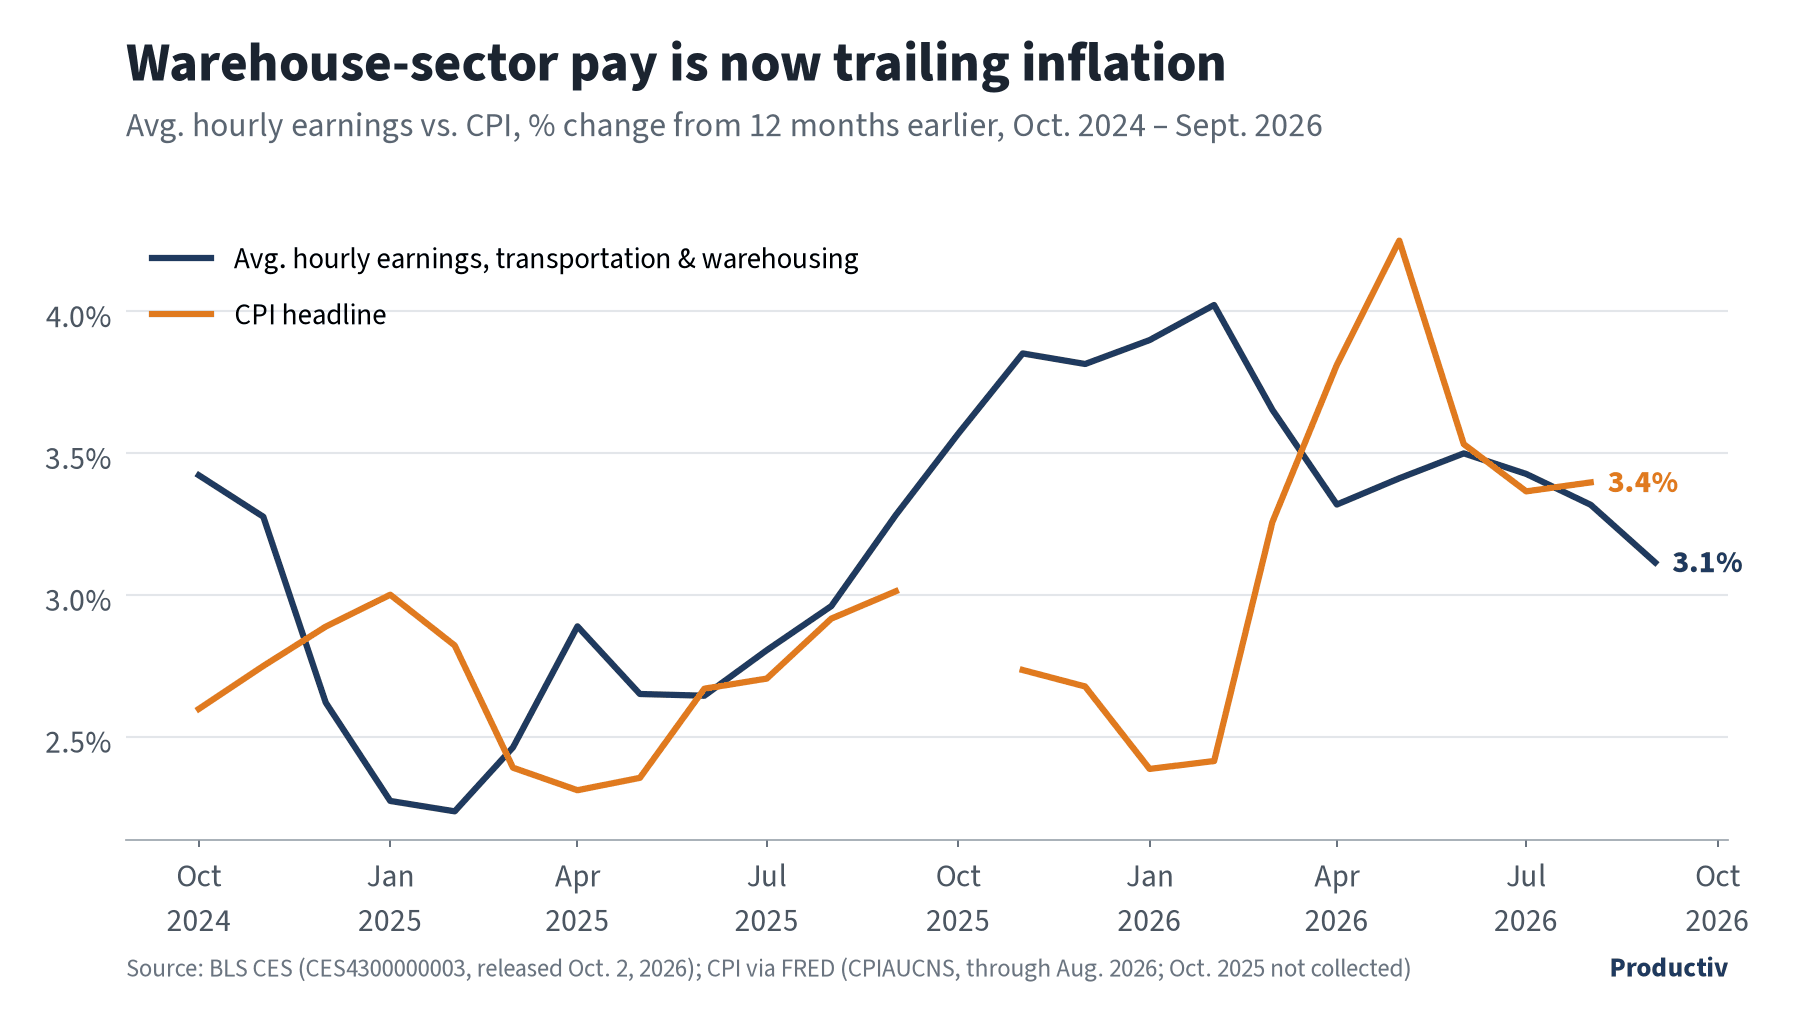
Chart data (table)
| Month | Avg. hourly earnings | CPI headline |
|---|---|---|
| Oct. 2024 | 3.4% | 2.6% |
| Nov. 2024 | 3.3% | 2.7% |
| Dec. 2024 | 2.6% | 2.9% |
| Jan. 2025 | 2.3% | 3.0% |
| Feb. 2025 | 2.2% | 2.8% |
| March 2025 | 2.5% | 2.4% |
| April 2025 | 2.9% | 2.3% |
| May 2025 | 2.7% | 2.4% |
| June 2025 | 2.6% | 2.7% |
| July 2025 | 2.8% | 2.7% |
| Aug. 2025 | 3.0% | 2.9% |
| Sept. 2025 | 3.3% | 3.0% |
| Oct. 2025 | 3.6% | n/a |
| Nov. 2025 | 3.9% | 2.7% |
| Dec. 2025 | 3.8% | 2.7% |
| Jan. 2026 | 3.9% | 2.4% |
| Feb. 2026 | 4.0% | 2.4% |
| March 2026 | 3.7% | 3.3% |
| April 2026 | 3.3% | 3.8% |
| May 2026 | 3.4% | 4.2% |
| June 2026 | 3.5% | 3.5% |
| July 2026 | 3.4% | 3.4% |
| Aug. 2026 | 3.3% | 3.4% |
| Sept. 2026 | 3.1% | n/a |
n/a: September 2026 CPI is released Oct. 14, 2026, and October 2025 CPI was not collected (federal shutdown).
Download CSV Data- Job openings and quits (JOLTS, transportation, warehousing & utilities, not seasonally adjusted): 353,000 openings in August. The quits rate was 2.0%, compared with 2.2% a year earlier (BLS, released Sept. 29).
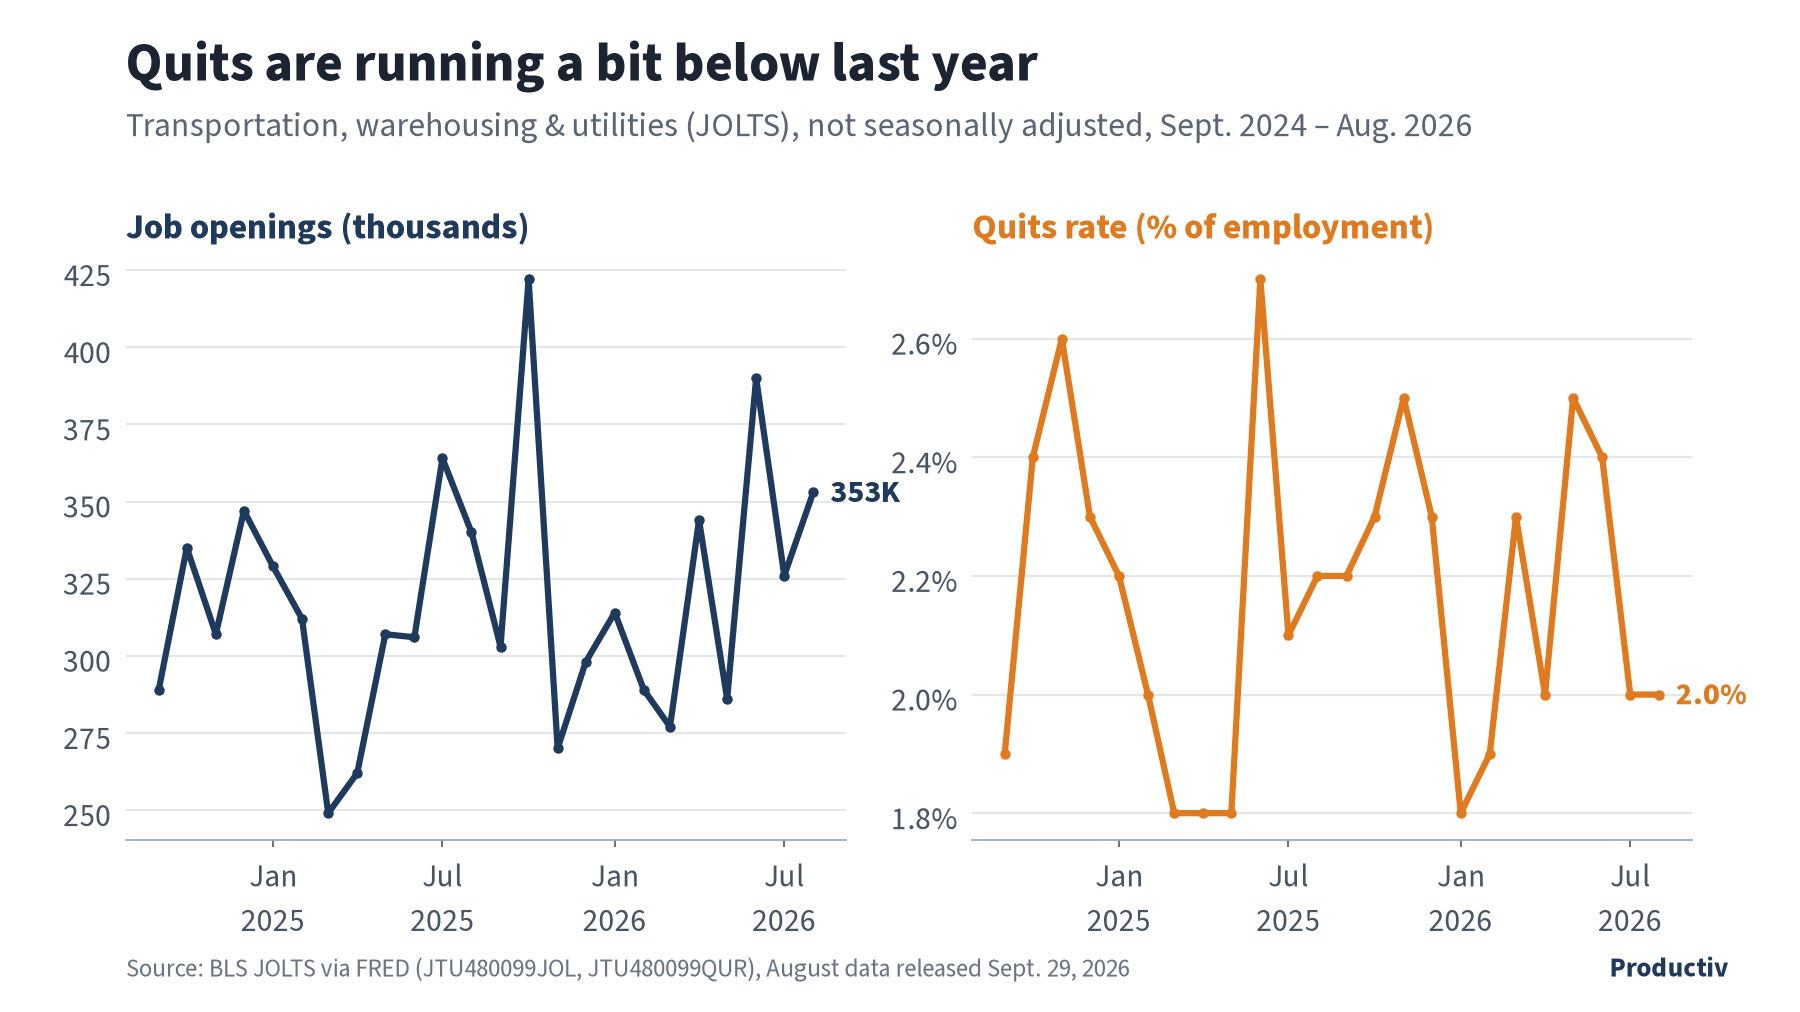
Chart data (table)
| Month | Job openings (thousands) | Quits rate |
|---|---|---|
| Sept. 2024 | 289 | 1.9% |
| Oct. 2024 | 335 | 2.4% |
| Nov. 2024 | 307 | 2.6% |
| Dec. 2024 | 347 | 2.3% |
| Jan. 2025 | 329 | 2.2% |
| Feb. 2025 | 312 | 2.0% |
| March 2025 | 249 | 1.8% |
| April 2025 | 262 | 1.8% |
| May 2025 | 307 | 1.8% |
| June 2025 | 306 | 2.7% |
| July 2025 | 364 | 2.1% |
| Aug. 2025 | 340 | 2.2% |
| Sept. 2025 | 303 | 2.2% |
| Oct. 2025 | 422 | 2.3% |
| Nov. 2025 | 270 | 2.5% |
| Dec. 2025 | 298 | 2.3% |
| Jan. 2026 | 314 | 1.8% |
| Feb. 2026 | 289 | 1.9% |
| March 2026 | 277 | 2.3% |
| April 2026 | 344 | 2.0% |
| May 2026 | 286 | 2.5% |
| June 2026 | 390 | 2.4% |
| July 2026 | 326 | 2.0% |
| Aug. 2026 | 353 | 2.0% |
- Overall payrolls (BLS): +29,000 with unemployment at 4.2%. Revisions cut July and August by a combined 60,000.
- ADP, September: +90,000 private jobs, with trade/transportation/utilities flat (0). Base pay for job-stayers rose 3.0% year over year, versus 4.8% for job-changers. Trade/transportation/utilities base pay was up 3.4%.
What it means
- Shippers & manufacturers
- Warehousing and storage lost 21,600 jobs over the year (September, BLS). Ask your 3PL how it will staff peak and what its turnover was last season.
- 3PLs & warehouse operators
- Job-changers got 4.8% raises versus 3.0% for stayers (ADP, September). Every trained operator who leaves during peak is replaced at a higher wage by someone still learning the work. Run the turnover cost before you set peak pay.
Sources: BLS Transportation & Warehousing, BLS Warehousing & Storage, BLS Employment Situation, Sept. 2026, BLS JOLTS via FRED, ADP National Employment Report
4. Industrial Real Estate (Q2 2026; Q3 reports due later this month)
- U.S.: Vacancy is 6.9%, down 10 bps from the prior quarter. Average asking rent is $10.32/sq ft, up 2.9% year over year.
See Cushman & Wakefield's Q2 2026 U.S. industrial vacancy and rent chart
- Dallas/Fort Worth: Vacancy is 8.1%, down 110 bps year over year. Asking rent hit a record $9.19/sq ft, up 13.2% year over year ($8.99 for warehouse/distribution).
See Cushman & Wakefield's Q2 2026 Dallas/Fort Worth vacancy and rent chart
- Charlotte: Vacancy is 7.4%, the fifth straight quarterly decline. Overall asking rent is $8.67/sq ft ($7.76 for warehouse/distribution).
See Cushman & Wakefield's Q2 2026 Charlotte vacancy and rent chart
What it means
- Shippers & manufacturers
- U.S. vacancy is 6.9% and asking rent is $10.32/sq ft, up 2.9% (Q2 2026). If you were waiting for a softer lease market, that window is closing. Price flexible 3PL capacity alongside any new lease.
- 3PLs & warehouse operators
- Dallas/Fort Worth asking rent is up 13.2% to a record $9.19/sq ft, and Charlotte vacancy has fallen five straight quarters to 7.4%. Space costs more at renewal, so output per square foot matters more.
Sources: Cushman & Wakefield U.S. Industrial MarketBeat, Dallas/Fort Worth, Charlotte
5. Freight
- Logistics Managers' Index (August): 66.6, down 2.2 from July (above 50 = expansion).
- Inventory levels: 52.8
- Warehousing capacity: 53.5 (+7.2, back in expansion)
- Warehousing prices: 75.0
- Transportation prices: 90.0
See the LMI's warehousing prices chart in the August 2026 report
See the LMI's transportation prices chart in the August 2026 report
- Cass Freight Index (August): Shipments +2.1% year over year, the first annual gain since January 2023. Expenditures +18.7% year over year.
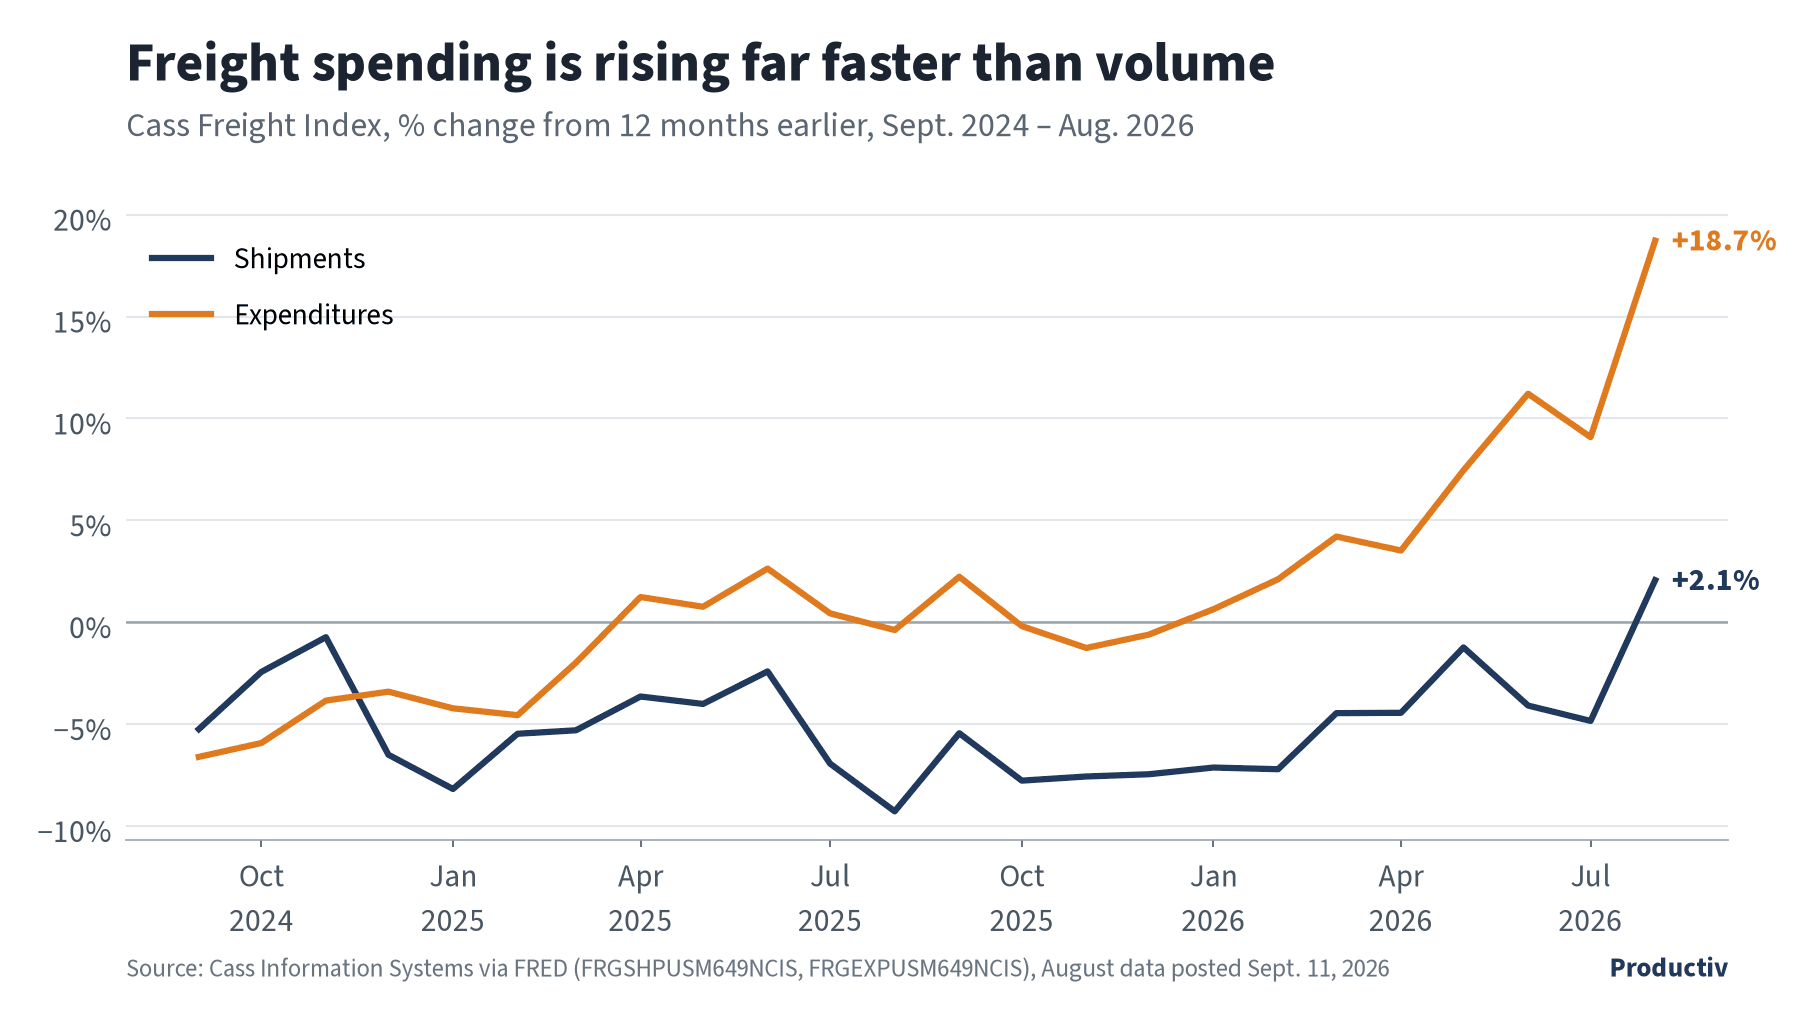
Chart data (table)
| Month | Shipments | Expenditures |
|---|---|---|
| Sept. 2024 | -5.2% | -6.6% |
| Oct. 2024 | -2.4% | -5.9% |
| Nov. 2024 | -0.7% | -3.8% |
| Dec. 2024 | -6.5% | -3.4% |
| Jan. 2025 | -8.2% | -4.2% |
| Feb. 2025 | -5.5% | -4.6% |
| March 2025 | -5.3% | -2.0% |
| April 2025 | -3.6% | +1.2% |
| May 2025 | -4.0% | +0.8% |
| June 2025 | -2.4% | +2.6% |
| July 2025 | -6.9% | +0.4% |
| Aug. 2025 | -9.3% | -0.4% |
| Sept. 2025 | -5.4% | +2.2% |
| Oct. 2025 | -7.8% | -0.2% |
| Nov. 2025 | -7.6% | -1.3% |
| Dec. 2025 | -7.5% | -0.6% |
| Jan. 2026 | -7.1% | +0.6% |
| Feb. 2026 | -7.2% | +2.1% |
| March 2026 | -4.5% | +4.2% |
| April 2026 | -4.4% | +3.5% |
| May 2026 | -1.2% | +7.5% |
| June 2026 | -4.1% | +11.2% |
| July 2026 | -4.8% | +9.1% |
| Aug. 2026 | +2.1% | +18.7% |
- Diesel (EIA): $6.382/gal for the week of Sept. 28. That's down 14.7¢ on the week but up $2.63 (about 70%) from a year ago.
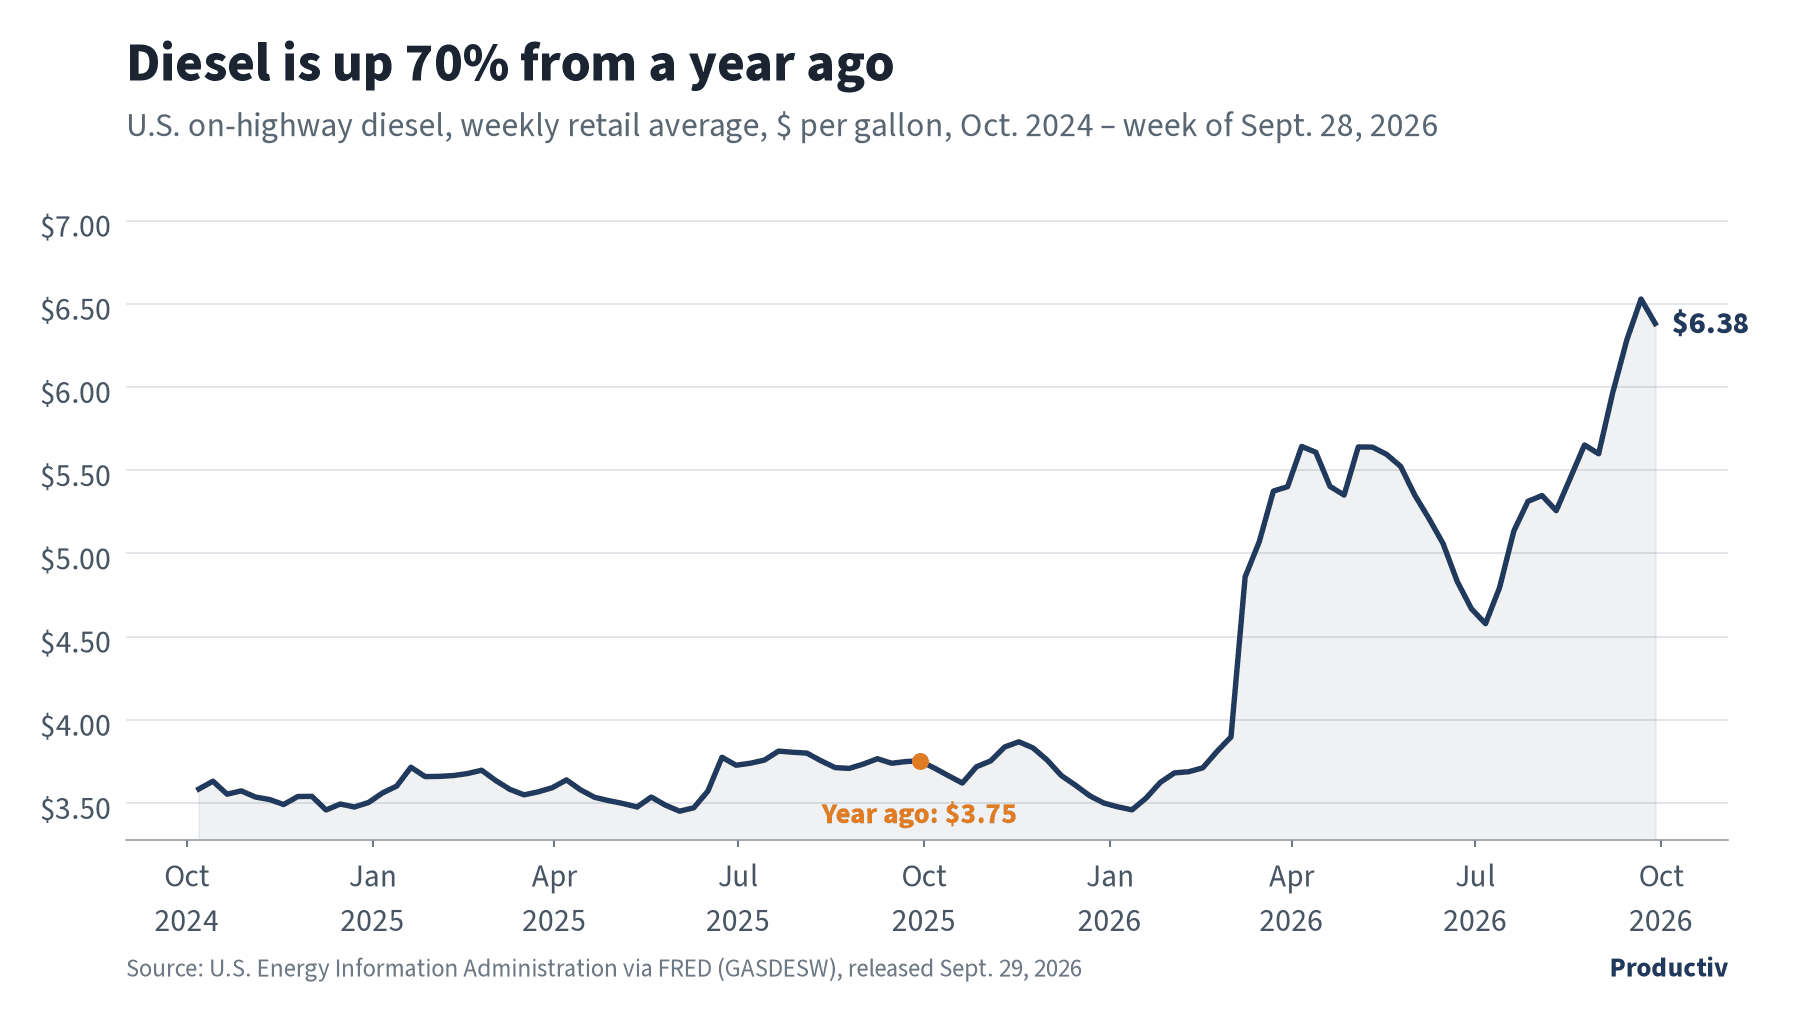
Chart data (table)
| Week of | Diesel ($/gal) |
|---|---|
| Oct. 28, 2024 | $3.573 |
| Nov. 25, 2024 | $3.539 |
| Dec. 30, 2024 | $3.503 |
| Jan. 27, 2025 | $3.659 |
| Feb. 24, 2025 | $3.697 |
| March 31, 2025 | $3.592 |
| April 28, 2025 | $3.514 |
| May 26, 2025 | $3.487 |
| June 30, 2025 | $3.727 |
| July 28, 2025 | $3.805 |
| Aug. 25, 2025 | $3.708 |
| Sept. 29, 2025 | $3.754 |
| Oct. 27, 2025 | $3.718 |
| Nov. 24, 2025 | $3.831 |
| Dec. 29, 2025 | $3.500 |
| Jan. 26, 2026 | $3.624 |
| Feb. 23, 2026 | $3.809 |
| March 30, 2026 | $5.401 |
| April 27, 2026 | $5.351 |
| May 25, 2026 | $5.523 |
| June 29, 2026 | $4.668 |
| July 27, 2026 | $5.313 |
| Aug. 31, 2026 | $5.599 |
| Sept. 28, 2026 | $6.382 |
Year-ago comparison: $3.754 for the week of Sept. 29, 2025. The download has every weekly reading.
Download CSV Data- DAT dry van (linehaul, excluding fuel): Spot averaged $2.17/mile last week, +31.9% year over year. In August, contract averaged $2.41 against $2.19 spot.
See DAT's dry van spot rate chart (2026 vs. 2017–2025)
- Truckload pricing: The BLS producer price index for long-distance truckload was up 13.9% year over year in August (released Sept. 10). The Cass Truckload Linehaul Index was up 11.3%.
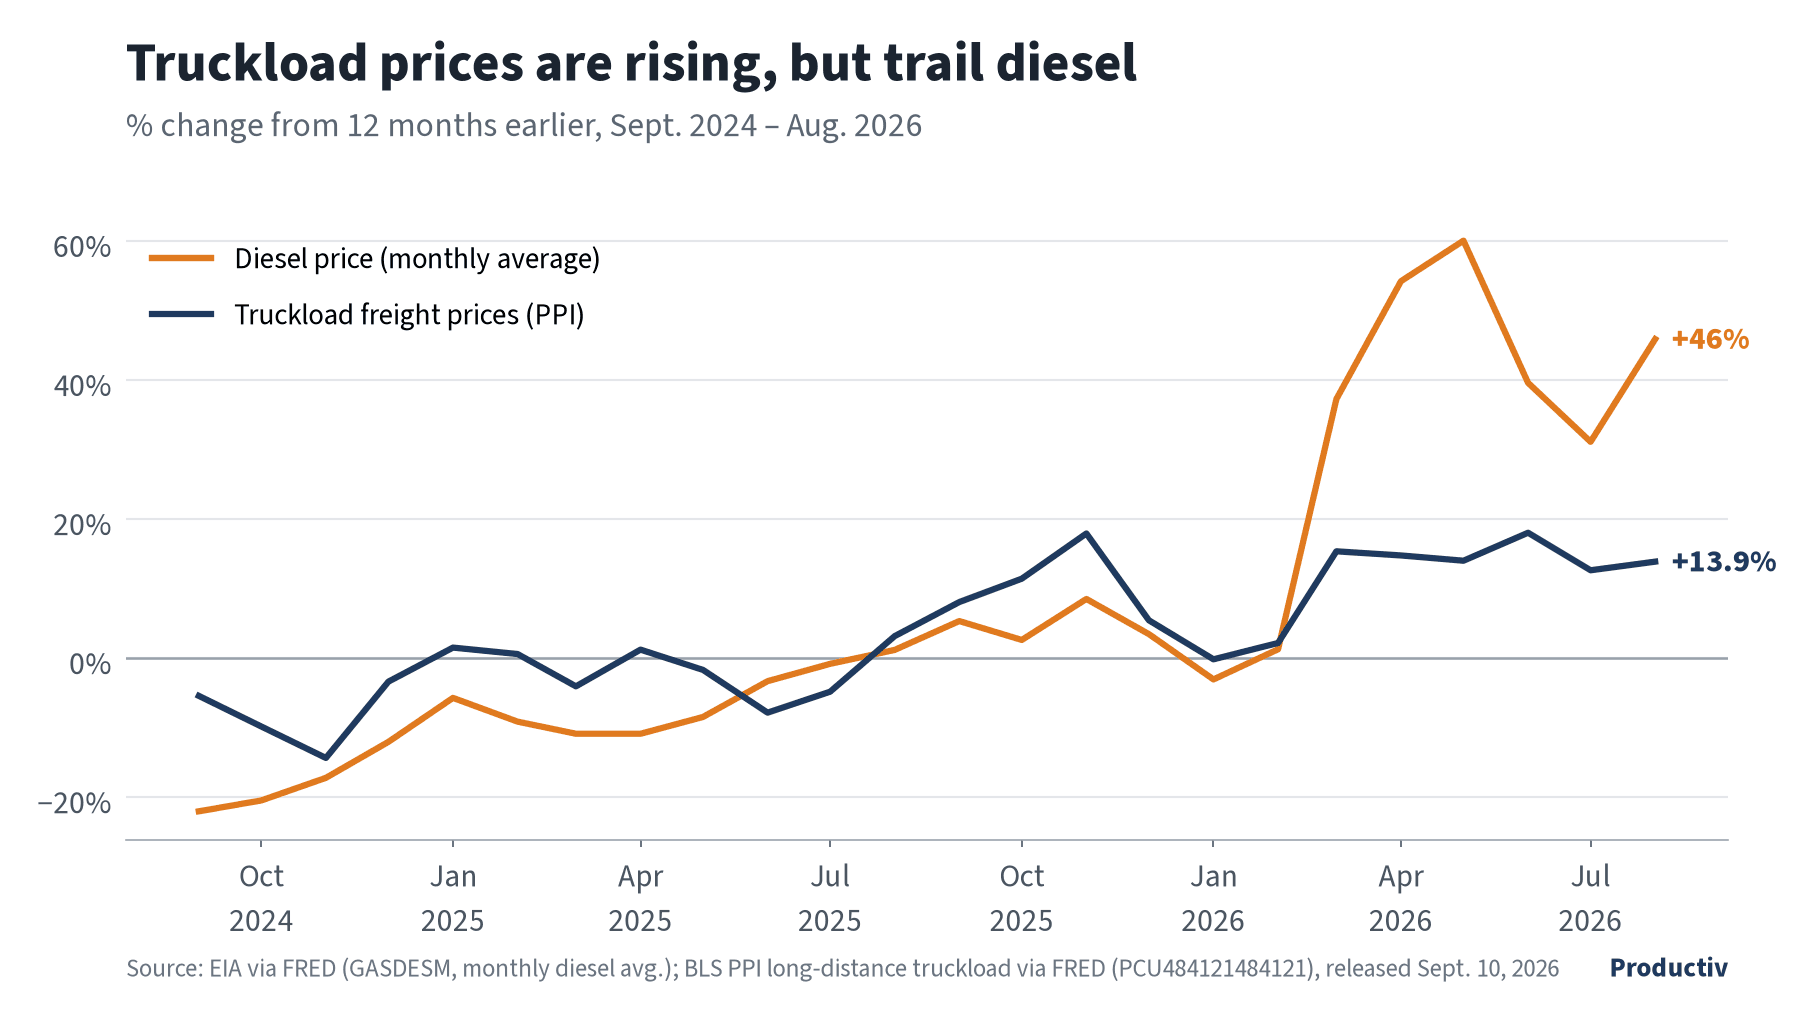
Chart data (table)
| Month | Diesel (monthly average) | Truckload freight prices (PPI) |
|---|---|---|
| Sept. 2024 | -22.0% | -5.4% |
| Oct. 2024 | -20.5% | -9.8% |
| Nov. 2024 | -17.2% | -14.3% |
| Dec. 2024 | -12.0% | -3.4% |
| Jan. 2025 | -5.7% | +1.5% |
| Feb. 2025 | -9.1% | +0.6% |
| March 2025 | -10.9% | -4.0% |
| April 2025 | -10.9% | +1.2% |
| May 2025 | -8.5% | -1.7% |
| June 2025 | -3.3% | -7.8% |
| July 2025 | -0.8% | -4.8% |
| Aug. 2025 | +1.2% | +3.2% |
| Sept. 2025 | +5.3% | +8.1% |
| Oct. 2025 | +2.6% | +11.4% |
| Nov. 2025 | +8.5% | +17.9% |
| Dec. 2025 | +3.5% | +5.5% |
| Jan. 2026 | -3.1% | -0.2% |
| Feb. 2026 | +1.3% | +2.2% |
| March 2026 | +37.3% | +15.4% |
| April 2026 | +54.2% | +14.8% |
| May 2026 | +60.0% | +14.0% |
| June 2026 | +39.6% | +18.0% |
| July 2026 | +31.1% | +12.6% |
| Aug. 2026 | +45.9% | +13.9% |
What it means
- Shippers & manufacturers
- Cass expenditures are up 18.7% year over year on shipments up 2.1% (August). Build 2027 freight budgets on cost, not volume, and plan for fuel volatility rather than a one-time spike.
- 3PLs & warehouse operators
- LMI warehousing prices hold at 75.0 while warehousing capacity loosened to 53.5 (August). Storage costs aren't falling yet, but customers will see the extra capacity coming.
- Transportation & fleets
- Diesel is $6.382/gal (week of Sept. 28), up about 70%, and DAT dry van spot is $2.17/mile, up 31.9%. Keep fuel surcharge tables current and plan for loaded miles.
Sources: LMI August 2026, Cass Transportation Index, August 2026, EIA Gasoline & Diesel Update, DAT Dry Van Report, DAT August rates, BLS PPI truckload via FRED
6. Parcel
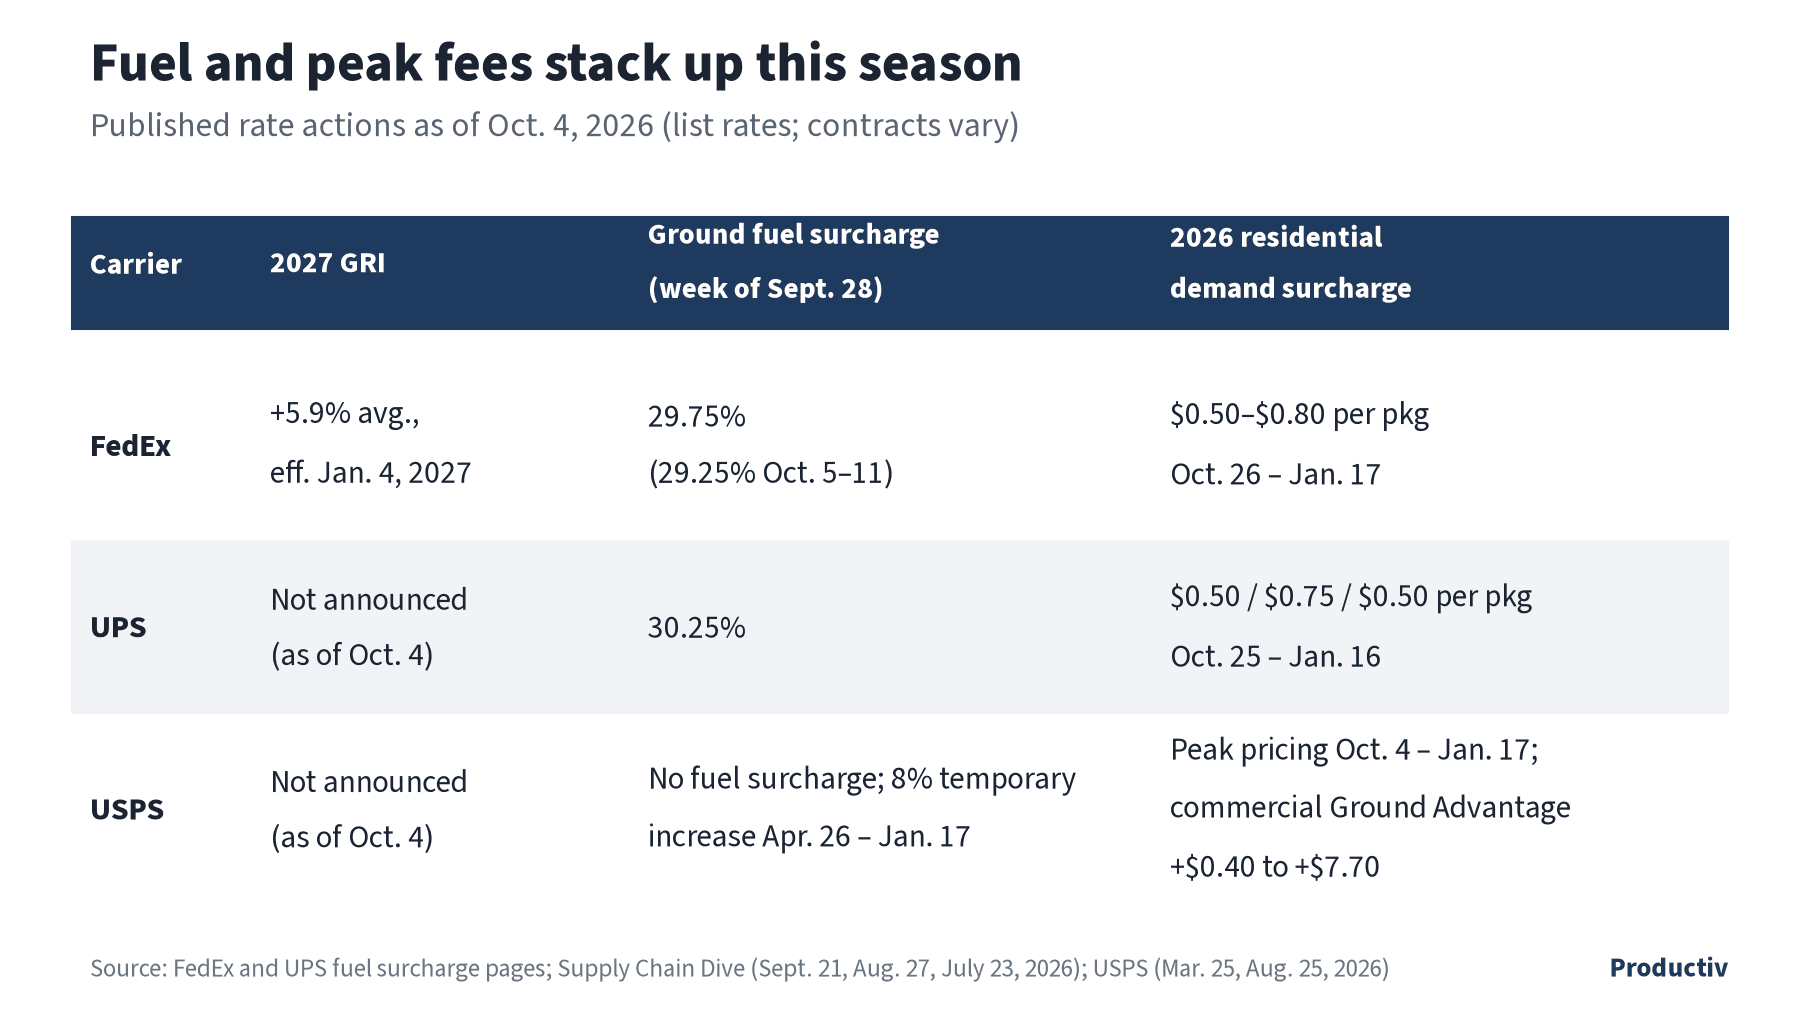
Chart data (table)
| Carrier | 2027 GRI | Ground fuel surcharge (week of Sept. 28) | 2026 residential demand surcharge |
|---|---|---|---|
| FedEx | +5.9% avg., effective Jan. 4, 2027 | 29.75% (29.25% Oct. 5–11) | $0.50–$0.80 per package, Oct. 26 – Jan. 17 |
| UPS | Not announced (as of Oct. 4) | 30.25% | $0.50 / $0.75 / $0.50 per package, Oct. 25 – Jan. 16 |
| USPS | Not announced (as of Oct. 4) | No fuel surcharge; 8% temporary increase Apr. 26 – Jan. 17 | Peak pricing Oct. 4 – Jan. 17; commercial Ground Advantage +$0.40 to +$7.70 |
2027 general rate increases
- FedEx: Average +5.9%, effective Jan. 4, 2027, the fourth year in a row at that level. The residential delivery charge rises from $6.95 to $7.35.
- UPS: No 2027 increase announced as of Oct. 4.
- USPS: No January 2027 shipping price change announced as of Oct. 4.
Fuel surcharges (week of Sept. 28 to Oct. 4)
- FedEx: Ground 29.75% (29.25% for Oct. 5 to 11). Express 33.00%.
- UPS: Ground 30.25%. Domestic Air 33.50%.
- USPS: No separate fuel surcharge. An 8% time-limited "transportation-related" increase on competitive parcels runs April 26, 2026 through Jan. 17, 2027.
2026 peak and demand surcharges
- UPS: Ground Residential is $0.50 (Oct. 25 to Nov. 21), then $0.75 (Nov. 22 to Dec. 26), then $0.50 through Jan. 16. Additional Handling runs $8.75 to $11.90 starting Sept. 27.
- FedEx: Ground/Home Delivery residential is $0.50 to $0.80 from Oct. 26 to Jan. 17. Additional Handling runs $8.80 to $11.85 starting Sept. 28.
- USPS: Peak pricing runs Oct. 4 to Jan. 17. For commercial Ground Advantage, it adds $0.40 (Zones 1–4, 0–3 lb) up to $7.70 (Zones 5–9, 26–70 lb).
What it means
- Shippers & manufacturers
- Ground fuel surcharges are 30.25% (UPS) and 29.75% (FedEx) for the week of Sept. 28, before any peak fee. Package dimensions and zone mix now move parcel cost more than FedEx's 5.9% GRI.
- 3PLs & warehouse operators
- Additional Handling runs $8.75 to $11.90 per package at UPS and $8.80 to $11.85 at FedEx this peak. Pack-out standards that avoid those triggers protect margin directly. Our peak readiness checklist covers where those costs hide.
Sources: Supply Chain Dive: FedEx 2027 rates, FedEx fuel surcharge, UPS fuel surcharge, Supply Chain Dive: UPS peak, Supply Chain Dive: FedEx peak, USPS peak pricing, USPS 8% increase
The Ecosystem Breakdown
One key indicator from each section, and which way it cuts for shippers, 3PLs and fleets this month.
| Indicator | Latest value | Change | Shippers & manufacturers | 3PLs & warehouses | Transportation & fleets |
|---|---|---|---|---|---|
| EconomyPPI, final demand | +5.4% y/y (Aug. 2026, BLS) | +0.4% m/m; core +4.7% y/y | HeadwindInput and packaging costs rising upstream | HeadwindSupply costs climb; check pass-through clauses | NeutralTruckload prices tracked separately above |
| Credit & Rates10-year Treasury | 5.24% (Oct. 1, 2026, FRED) | From 4.12% a year ago | HeadwindCostlier to carry peak inventory | HeadwindHigher bar for automation payback | HeadwindEquipment financing costs more |
| LaborWarehousing & storage employment | 1,831,800 (Sept. 2026, prelim., BLS) | −21,600 y/y; −4,100 m/m | HeadwindAsk how your 3PL staffs peak | HeadwindJob-changers get 4.8% vs. 3.0% for stayers | NeutralTransportation & warehousing jobs +7,600 m/m |
| Industrial Real EstateU.S. industrial vacancy | 6.9% (Q2 2026, Cushman & Wakefield) | −10 bps q/q; rent $10.32/sq ft, +2.9% y/y | HeadwindLease window narrowing; price flexible capacity | NeutralFirmer rents at renewal; space must earn its keep | NeutralNo direct effect |
| FreightU.S. on-highway diesel | $6.382/gal (week of Sept. 28, 2026, EIA) | +$2.63 y/y (about 70%) | HeadwindFuel in every freight bill | HeadwindInbound and outbound freight costs up | HeadwindFuel up about 70%; dry van spot +31.9% |
| ParcelUPS ground fuel surcharge | 30.25% (week of Sept. 28, 2026) | FedEx 2027 GRI +5.9%; peak fees from Oct. 25–26 | HeadwindAbout 30% fuel plus peak fees per parcel | NeutralPack-out standards decide surcharge exposure | NeutralNo direct effect |
Deep dive: peak-season labor retention
The warehouse labor market is shrinking, not tightening. Warehousing and storage employment was 1,831,800 in September (preliminary), down 21,600 from a year earlier. Transportation and warehousing pay rose 3.1% in September, against 3.4% CPI inflation in August. Real pay is flat to negative.
People are mostly staying put. The quits rate for transportation, warehousing and utilities was 2.0% in August, down from 2.2% a year earlier. But the ones who leave are paid well to do it: ADP puts raises for job-changers at 4.8%, against 3.0% for people who stay.
That gap matters most on the work that takes longest to learn. A multi-component kit, a retailer's routing guide, an ASN that has to match the carton it describes: these run on people who already know the build and the customer's rules. A replacement hired in November is still learning in December.
New-hire mistakes show up as retailer chargebacks and reships, and this year reships cost more. Ground fuel surcharges are 30.25% at UPS and 29.75% at FedEx (week of Sept. 28). Peak residential and Additional Handling fees, up to $11.90 per package at UPS, apply on top.
The same math applies inside manufacturing plants. With the PMI at 54.5 and new orders at 55.3, factories are adding output. Plants that lean on temp labor for kitting and packaging lines feel turnover as missed schedules, not just higher cost.
Whether the team runs in a 3PL building or inside the client's plant, the operations that keep the same leads and trained operators from September through January should have the steadier peak. Before peak, compare what retention pay costs with what a lost trained operator costs in rework, chargebacks and reships.
Operational directives
Optimize: staffing and throughput
- Lock peak rosters now. Tie retention pay to finishing the season, and remember you are competing with the 4.8% raises job-changers are getting.
- Put your most experienced operators on the most complex builds and use new hires on simpler pick-and-pack work, where errors are easier to catch.
- Track output per labor hour weekly through January, not just headcount against plan.
Safeguard: retail compliance and chargebacks
- Audit routing guide and ASN/EDI accuracy before peak volume, not after the first chargeback notice.
- Freeze display and kit build specs early, and check the first unit of every new build against the spec before the line runs.
- Pair new hires with a trained lead on labeling and compliance-critical stations.
Synchronize: production and regional fulfillment
- With diesel at $6.382/gal and truckload producer prices up 13.9%, move finished goods to regional fulfillment in planned full loads rather than expedited partials.
- Time production runs to fulfillment windows. At a 5.24% 10-year Treasury, finished goods sitting early are a cost, not a buffer.
- Position inventory closer to demand: USPS peak pricing adds up to $7.70 per package (Zones 5–9, 26–70 lb).
What's next
September CPI comes out Oct. 14 and September PPI on Oct. 15. The Fed meets Oct. 27–28, and the Q3 GDP advance estimate is due Oct. 29. Our next issue arrives in early November.
Monthly · Free
Get Labor & Logistics Indicators every month
Our read on the numbers that shape warehouse labor, fulfillment and freight, in your inbox once a month.
If peak surcharges are changing your fulfillment math, talk to our team.
About this report and methodology
Labor & Logistics Indicators is published monthly by Productiv. It is built from official public data (BEA, BLS, the Federal Reserve, Freddie Mac, EIA, FRED and the Census Bureau) and named industry sources (Cushman & Wakefield, the Logistics Managers' Index, DAT, Cass, ISM, UPS, FedEx and USPS). Every figure is linked to its source with its reference period and release date. It contains no proprietary Productiv data.
How figures are calculated: year-over-year and month-over-month changes are taken from the official series as published. Our charts plot about 24 months of published data without estimates or seasonal adjustments of our own. Third-party charts are linked, not reproduced.
The Productiv Labor & Logistics Pressure Index is different: it is a Productiv calculation from public data, not a figure as published by a source (see the methodology). Each issue recomputes its full history. If a month we have already published moves by 1 point or more, we note it in a footnote in the new issue; past issues are not edited.
Revisions: when a source revises a figure, we update it on this page, change the “Updated” date and note what changed. Past issues keep their URLs.
Productiv, Inc. is headquartered in Midlothian, Virginia. It runs 3PL fulfillment in Dallas and Charlotte, and onsite kitting and co-packing teams inside client plants in Richmond, Charlotte, Raleigh, Dallas and Salt Lake City.
Cite as: Productiv, Labor & Logistics Indicators, October 2026, https://getproductiv.com/insights/labor-logistics-indicators/2026-10