Labor & Logistics Indicators · August 2026 · Retrospective
August 2026 Report: Pressure Index 137.4 for June
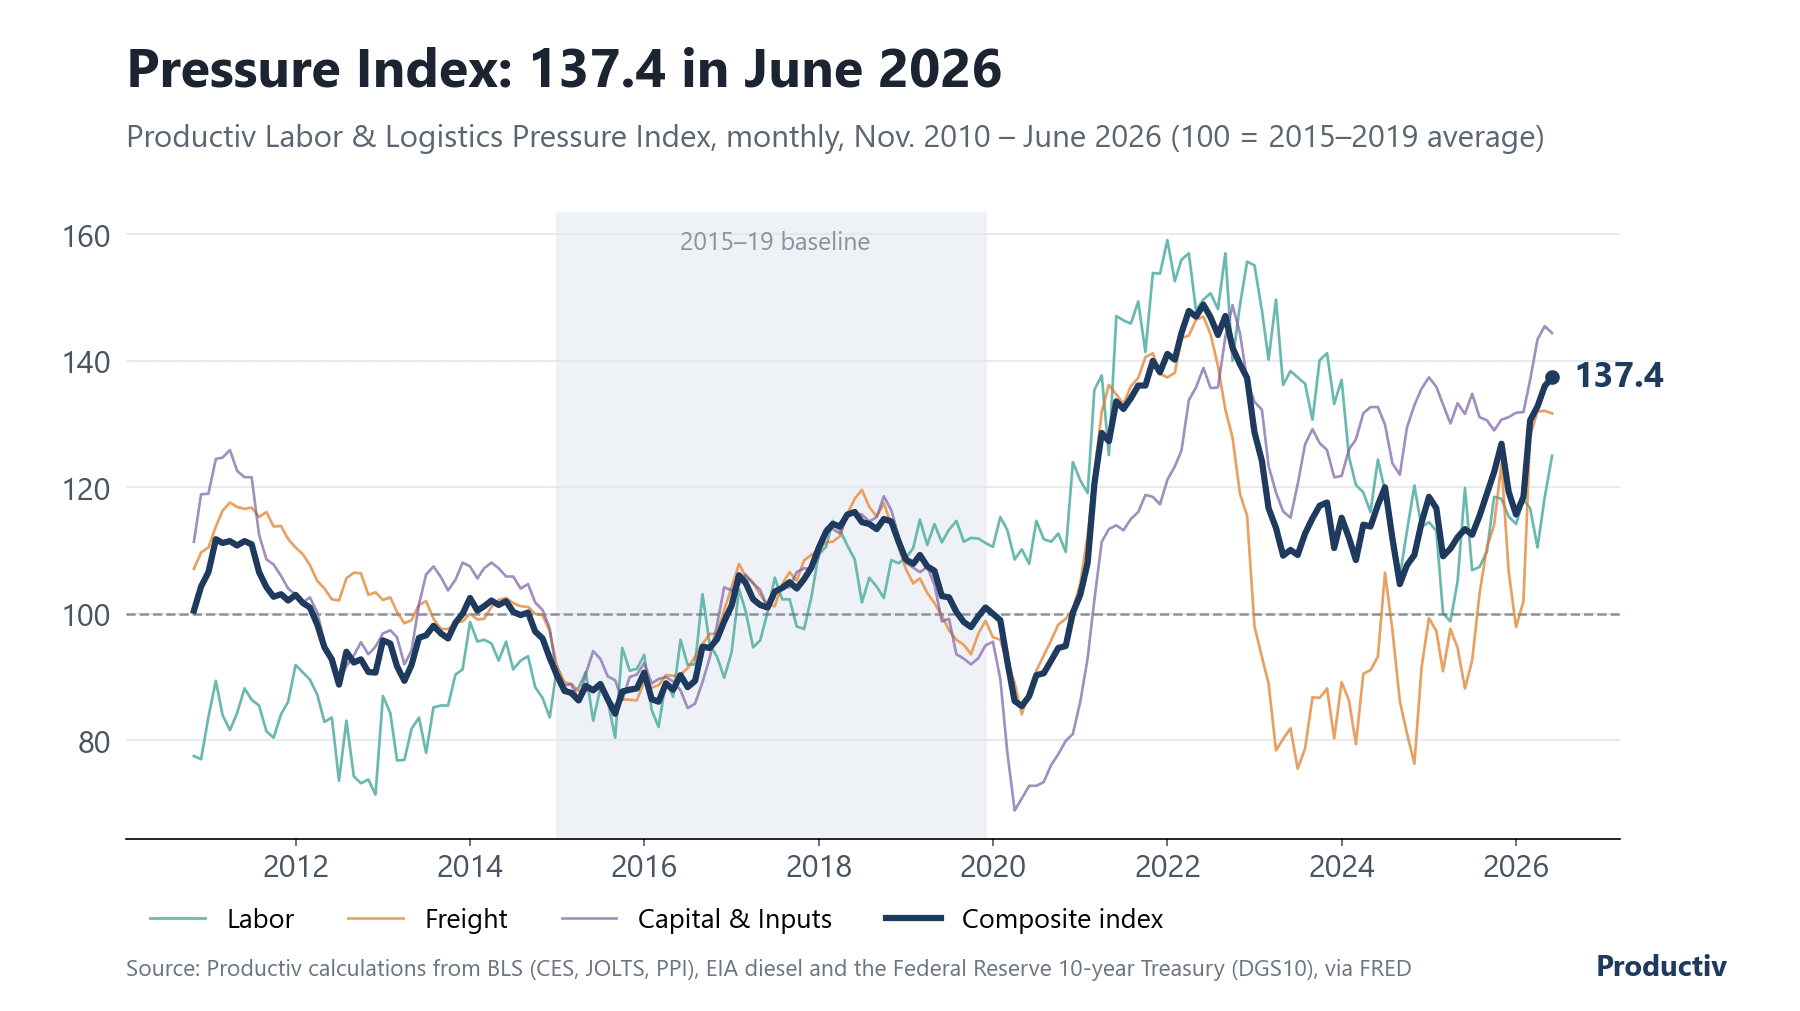
The Productiv Labor & Logistics Pressure Index
June 2026 (final)
137.4
+1.4 pts m/m · +24.0 pts y/y
- Labor
- 125.0
- Freight
- 131.7
- Capital & Inputs
- 144.4
How to read it: 100 = the 2015–2019 average; every 10 points is one normal-year swing; higher = more cost and labor pressure.
Data table and CSV: getproductiv.com/data/labor-logistics-indicators/2026-08/00-pressure-index.csv
Chart data (table)
| Month | Index | Labor | Freight | Capital & Inputs |
|---|---|---|---|---|
| July 2024 | 120.0 | 119.4 | 106.5 | 129.9 |
| Aug. 2024 | 111.9 | 112.8 | 97.4 | 123.8 |
| Sept. 2024 | 104.7 | 105.9 | 86.2 | 122.0 |
| Oct. 2024 | 107.7 | 113.1 | 81.1 | 129.5 |
| Nov. 2024 | 109.3 | 120.3 | 76.3 | 133.0 |
| Dec. 2024 | 114.4 | 113.7 | 91.5 | 135.6 |
| Jan. 2025 | 118.5 | 114.5 | 99.3 | 137.4 |
| Feb. 2025 | 116.7 | 113.1 | 97.3 | 135.9 |
| March 2025 | 109.1 | 100.1 | 90.9 | 133.1 |
| April 2025 | 110.3 | 98.8 | 97.6 | 130.1 |
| May 2025 | 112.1 | 105.1 | 94.6 | 133.3 |
| June 2025 | 113.4 | 119.9 | 88.2 | 131.6 |
| July 2025 | 112.5 | 106.9 | 92.6 | 134.8 |
| Aug. 2025 | 115.5 | 107.4 | 103.2 | 131.1 |
| Sept. 2025 | 119.0 | 109.9 | 110.5 | 130.6 |
| Oct. 2025 | 122.4 | 118.5 | 114.0 | 129.0 |
| Nov. 2025 | 126.9 | 118.2 | 123.8 | 130.7 |
| Dec. 2025 | 119.3 | 115.4 | 106.7 | 131.1 |
| Jan. 2026 | 115.7 | 114.2 | 97.9 | 131.8 |
| Feb. 2026 | 118.5 | 118.0 | 102.0 | 131.9 |
| March 2026 | 130.6 | 116.7 | 128.2 | 137.0 |
| April 2026 | 132.8 | 110.5 | 132.0 | 143.4 |
| May 2026 | 136.0 | 118.4 | 132.1 | 145.5 |
| June 2026 | 137.4 | 125.0 | 131.7 | 144.4 |
Full monthly history since Nov. 2010, with each component's raw value, transform and z-score, is in the CSV.
Download CSV DataHow the index is built: components, weights, baseline and revision policy
June 2026 at a glance
- The Productiv Labor & Logistics Pressure Index read 137.4 in June 2026, +1.4 points from the prior month and +24.0 from a year earlier. Labor 125.0, Freight 131.7, Capital & Inputs 144.4.
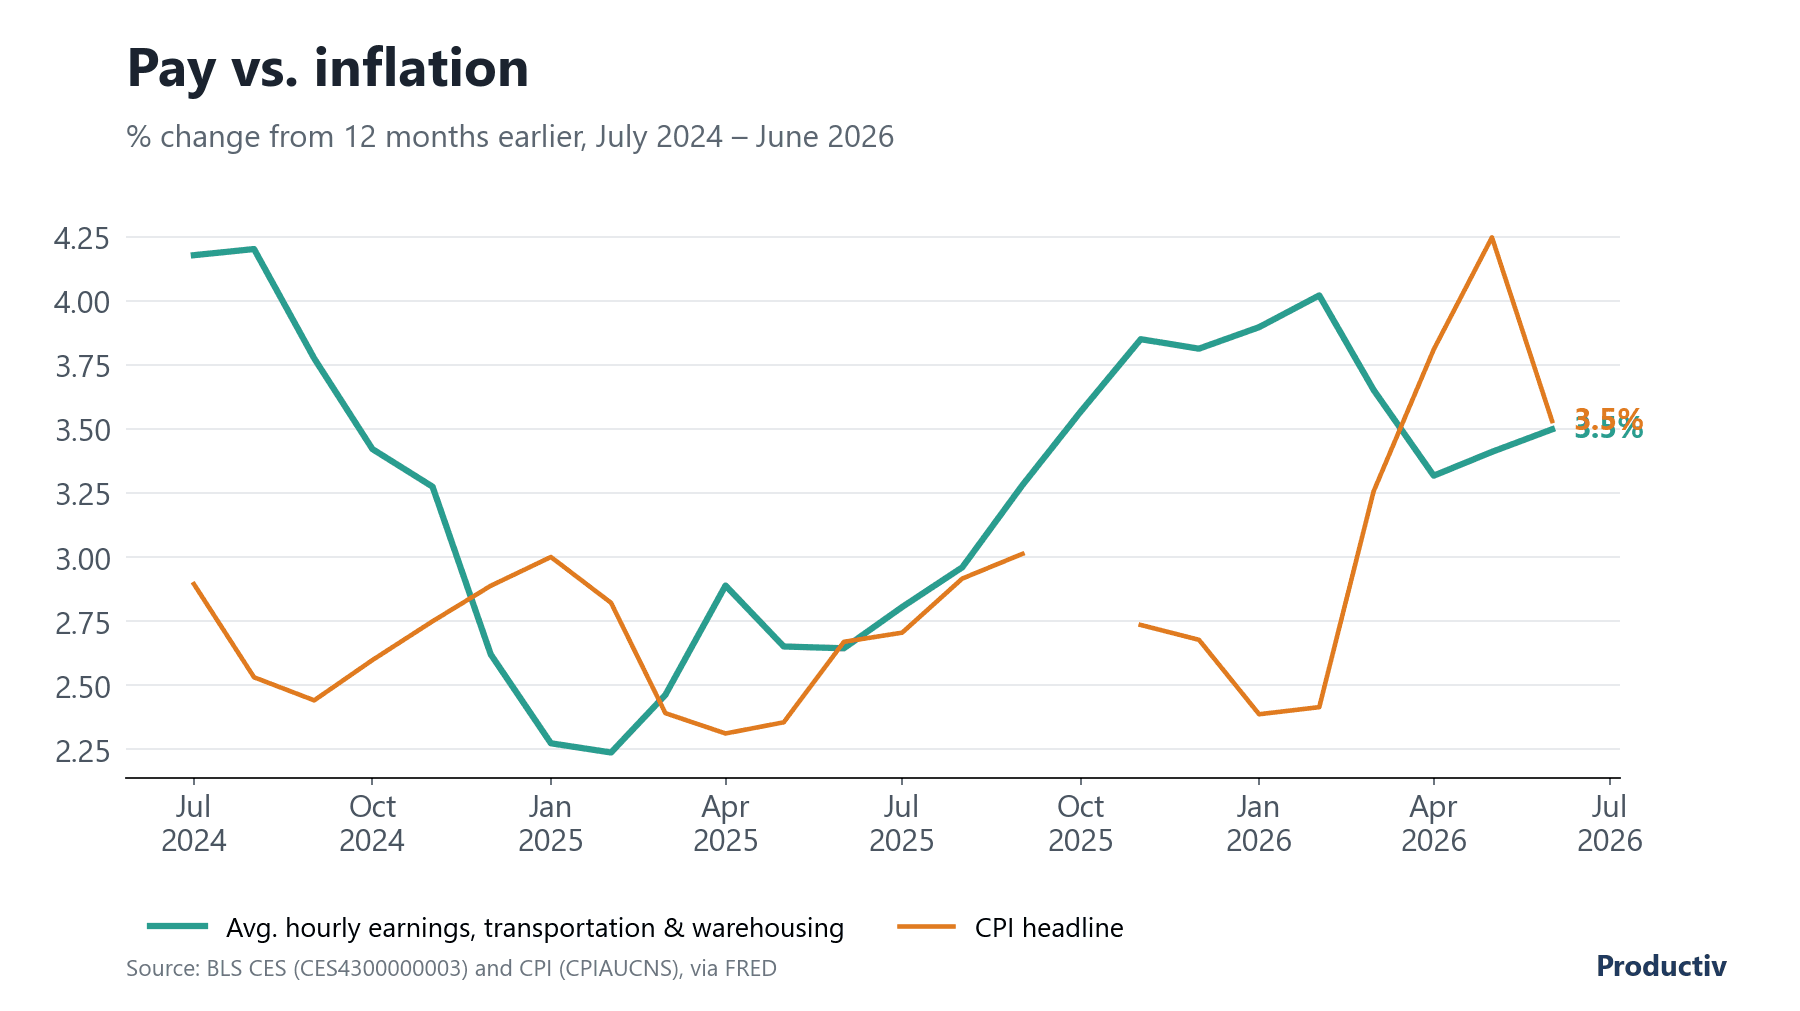
- Transportation and warehousing average hourly earnings were up 3.5% from a year earlier, against CPI inflation of 3.5% (BLS).
- Diesel averaged $5.02/gal, up 39.6% from a year earlier (EIA), and long-distance truckload producer prices were up 17.6% (BLS).
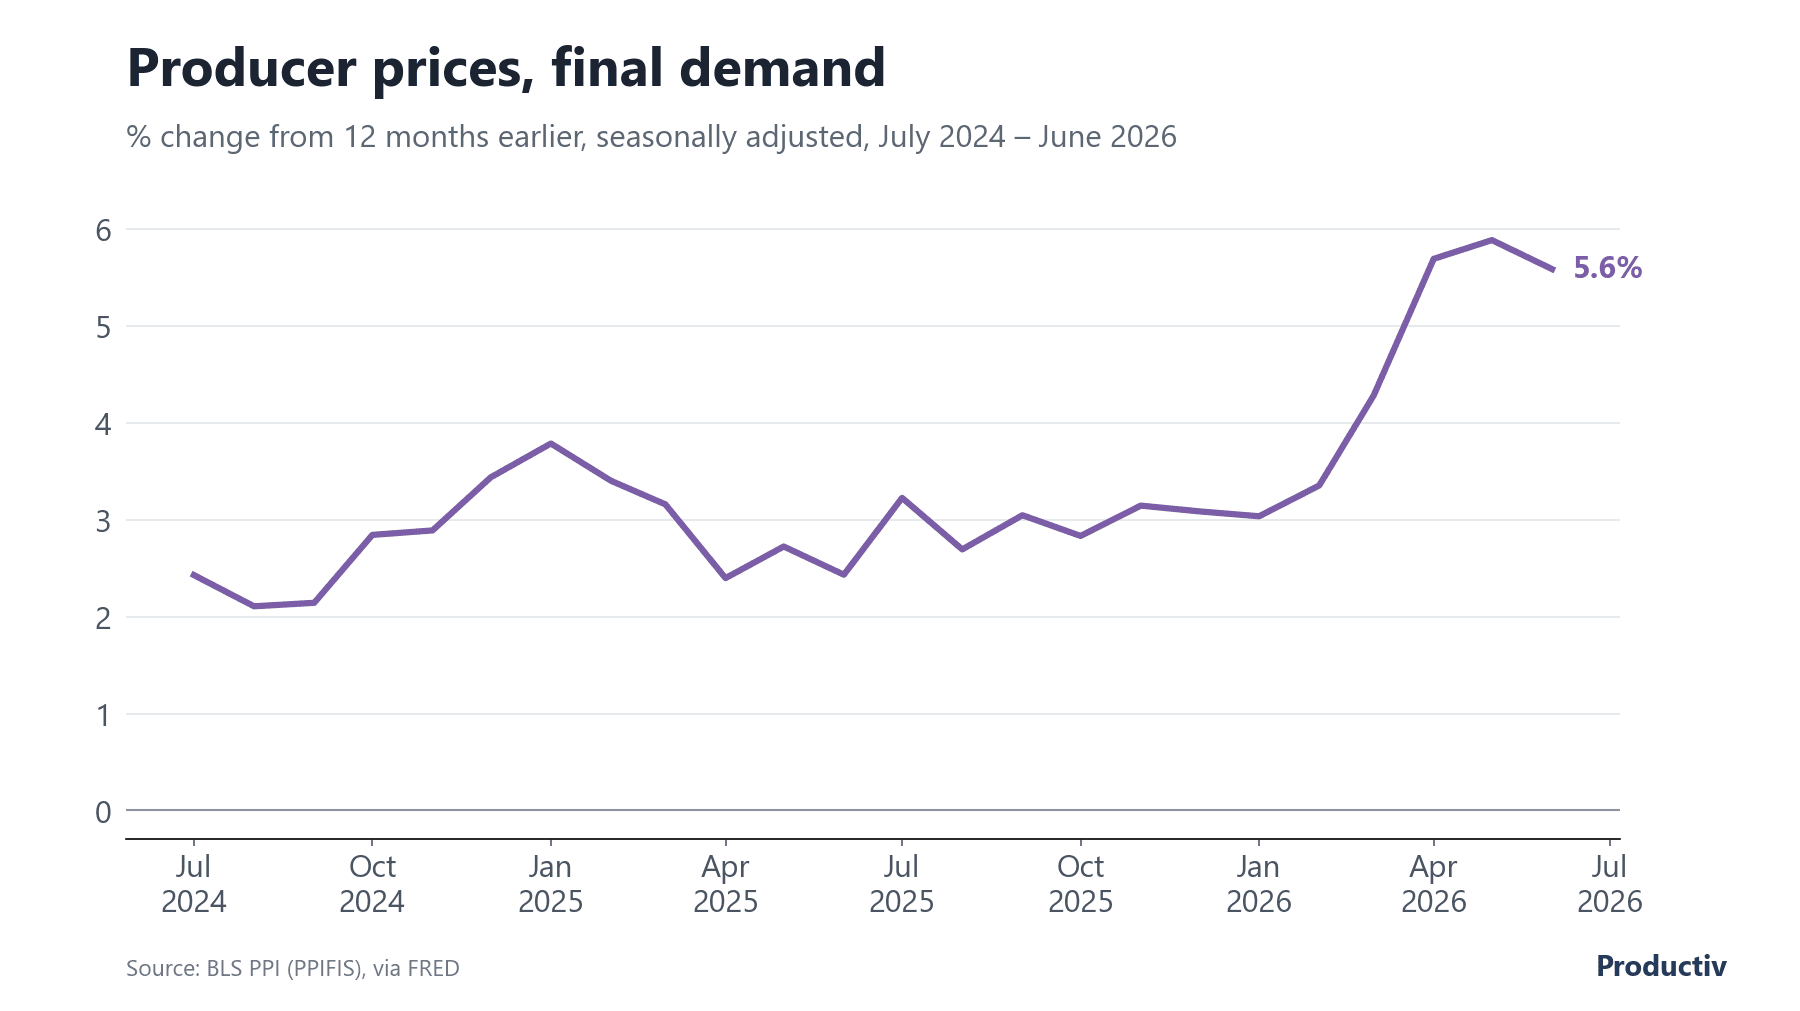
- Producer prices for final demand were up 5.6% year over year (BLS), and the 10-year Treasury averaged 4.47% (Federal Reserve).
The index inputs
Pay and inflation (Labor), fuel and truckload prices (Freight), and producer prices and the 10-year Treasury (Capital & Inputs), through June 2026.
Data table and CSV: getproductiv.com/data/labor-logistics-indicators/2026-08/r1-pay-vs-cpi.csv
Chart data (table)
| Month | Avg. hourly earnings | CPI headline |
|---|---|---|
| July 2024 | 4.2% | 2.9% |
| Aug. 2024 | 4.2% | 2.5% |
| Sept. 2024 | 3.8% | 2.4% |
| Oct. 2024 | 3.4% | 2.6% |
| Nov. 2024 | 3.3% | 2.7% |
| Dec. 2024 | 2.6% | 2.9% |
| Jan. 2025 | 2.3% | 3.0% |
| Feb. 2025 | 2.2% | 2.8% |
| March 2025 | 2.5% | 2.4% |
| April 2025 | 2.9% | 2.3% |
| May 2025 | 2.7% | 2.4% |
| June 2025 | 2.6% | 2.7% |
| July 2025 | 2.8% | 2.7% |
| Aug. 2025 | 3.0% | 2.9% |
| Sept. 2025 | 3.3% | 3.0% |
| Oct. 2025 | 3.6% | n/a |
| Nov. 2025 | 3.9% | 2.7% |
| Dec. 2025 | 3.8% | 2.7% |
| Jan. 2026 | 3.9% | 2.4% |
| Feb. 2026 | 4.0% | 2.4% |
| March 2026 | 3.7% | 3.3% |
| April 2026 | 3.3% | 3.8% |
| May 2026 | 3.4% | 4.2% |
| June 2026 | 3.5% | 3.5% |
October 2025 CPI was not collected during the federal shutdown, so October 2025 and October 2026 have no CPI change.
Download CSV Data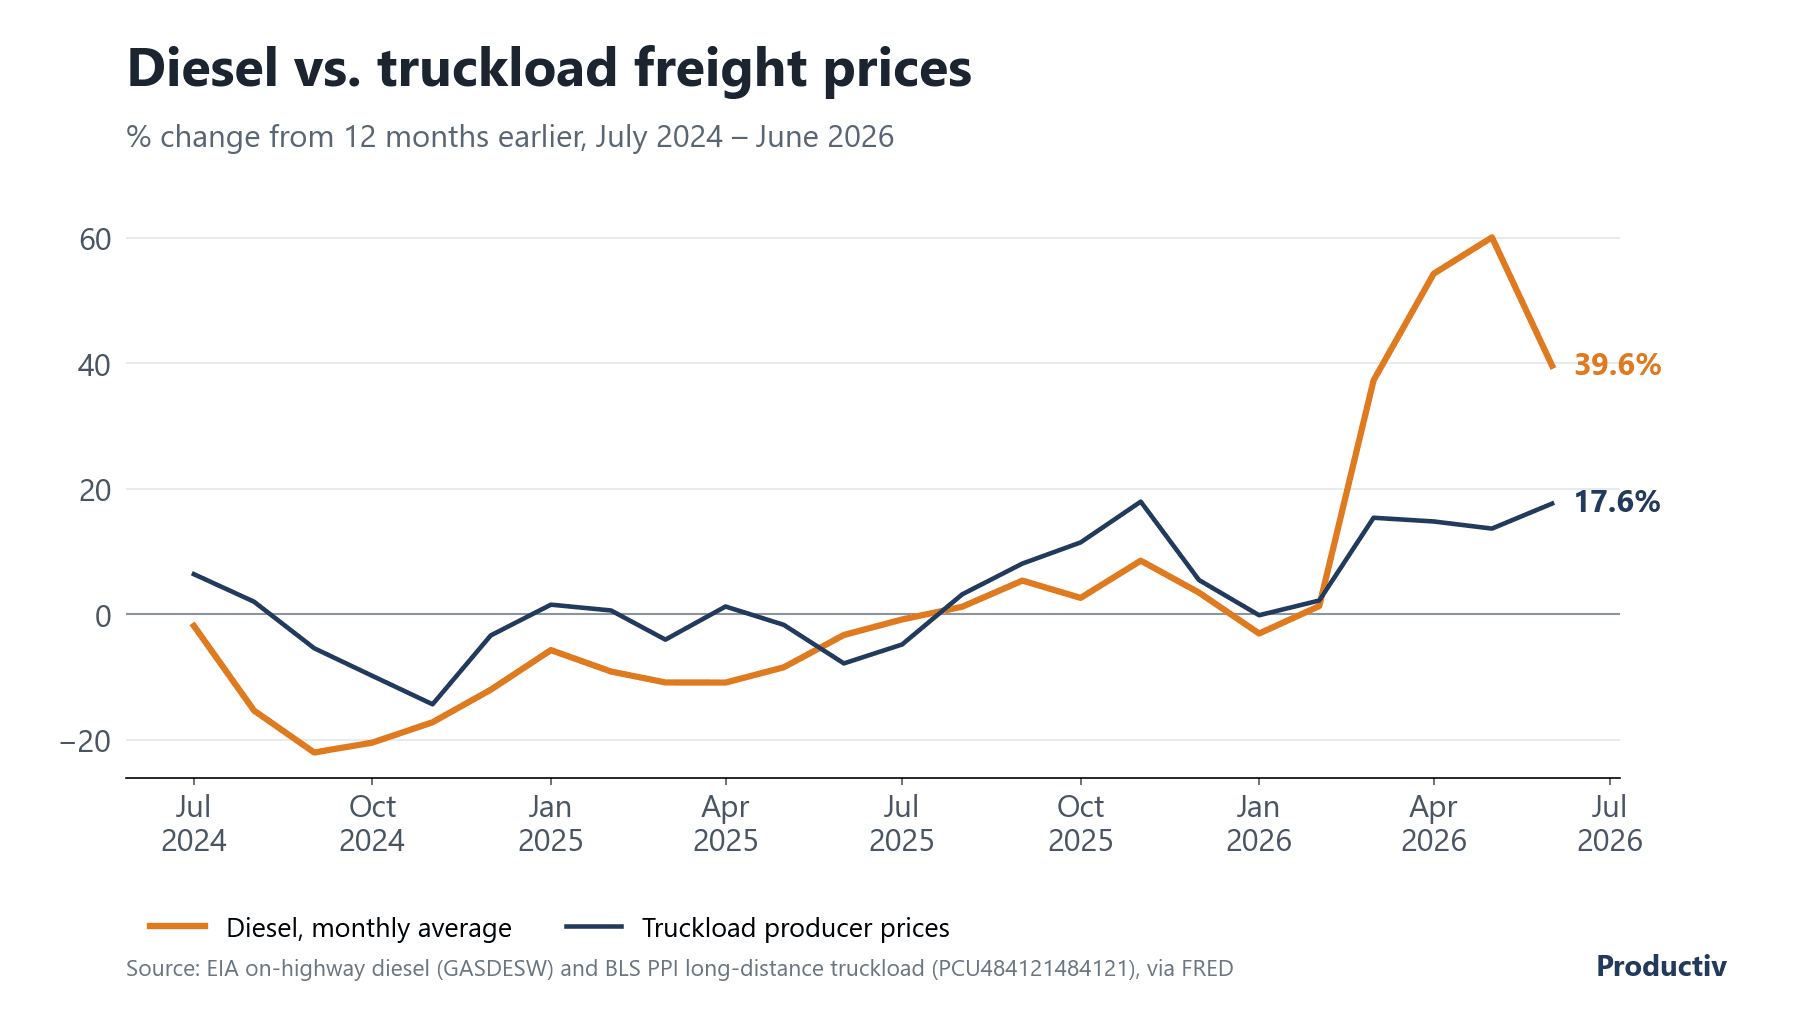
Data table and CSV: getproductiv.com/data/labor-logistics-indicators/2026-08/r2-diesel-vs-truckload.csv
Chart data (table)
| Month | Diesel ($/gal) | Diesel y/y | Truckload PPI y/y |
|---|---|---|---|
| July 2024 | $3.81 | -1.9% | +6.4% |
| Aug. 2024 | $3.70 | -15.3% | +2.0% |
| Sept. 2024 | $3.56 | -22.0% | -5.4% |
| Oct. 2024 | $3.59 | -20.4% | -9.8% |
| Nov. 2024 | $3.52 | -17.2% | -14.3% |
| Dec. 2024 | $3.49 | -12.0% | -3.4% |
| Jan. 2025 | $3.63 | -5.7% | +1.5% |
| Feb. 2025 | $3.67 | -9.1% | +0.6% |
| March 2025 | $3.58 | -10.9% | -4.0% |
| April 2025 | $3.57 | -10.9% | +1.2% |
| May 2025 | $3.50 | -8.5% | -1.7% |
| June 2025 | $3.60 | -3.3% | -7.8% |
| July 2025 | $3.78 | -0.8% | -4.8% |
| Aug. 2025 | $3.74 | +1.2% | +3.2% |
| Sept. 2025 | $3.75 | +5.4% | +8.1% |
| Oct. 2025 | $3.68 | +2.6% | +11.4% |
| Nov. 2025 | $3.82 | +8.5% | +17.9% |
| Dec. 2025 | $3.61 | +3.5% | +5.5% |
| Jan. 2026 | $3.52 | -3.1% | -0.2% |
| Feb. 2026 | $3.72 | +1.3% | +2.2% |
| March 2026 | $4.92 | +37.3% | +15.4% |
| April 2026 | $5.50 | +54.2% | +14.8% |
| May 2026 | $5.60 | +60.0% | +13.6% |
| June 2026 | $5.02 | +39.6% | +17.6% |
Data table and CSV: getproductiv.com/data/labor-logistics-indicators/2026-08/r3-ppi-final-demand.csv
Chart data (table)
| Month | PPI final demand |
|---|---|
| July 2024 | +2.4% |
| Aug. 2024 | +2.1% |
| Sept. 2024 | +2.1% |
| Oct. 2024 | +2.8% |
| Nov. 2024 | +2.9% |
| Dec. 2024 | +3.4% |
| Jan. 2025 | +3.8% |
| Feb. 2025 | +3.4% |
| March 2025 | +3.2% |
| April 2025 | +2.4% |
| May 2025 | +2.7% |
| June 2025 | +2.4% |
| July 2025 | +3.2% |
| Aug. 2025 | +2.7% |
| Sept. 2025 | +3.0% |
| Oct. 2025 | +2.8% |
| Nov. 2025 | +3.1% |
| Dec. 2025 | +3.1% |
| Jan. 2026 | +3.0% |
| Feb. 2026 | +3.4% |
| March 2026 | +4.3% |
| April 2026 | +5.7% |
| May 2026 | +5.9% |
| June 2026 | +5.6% |
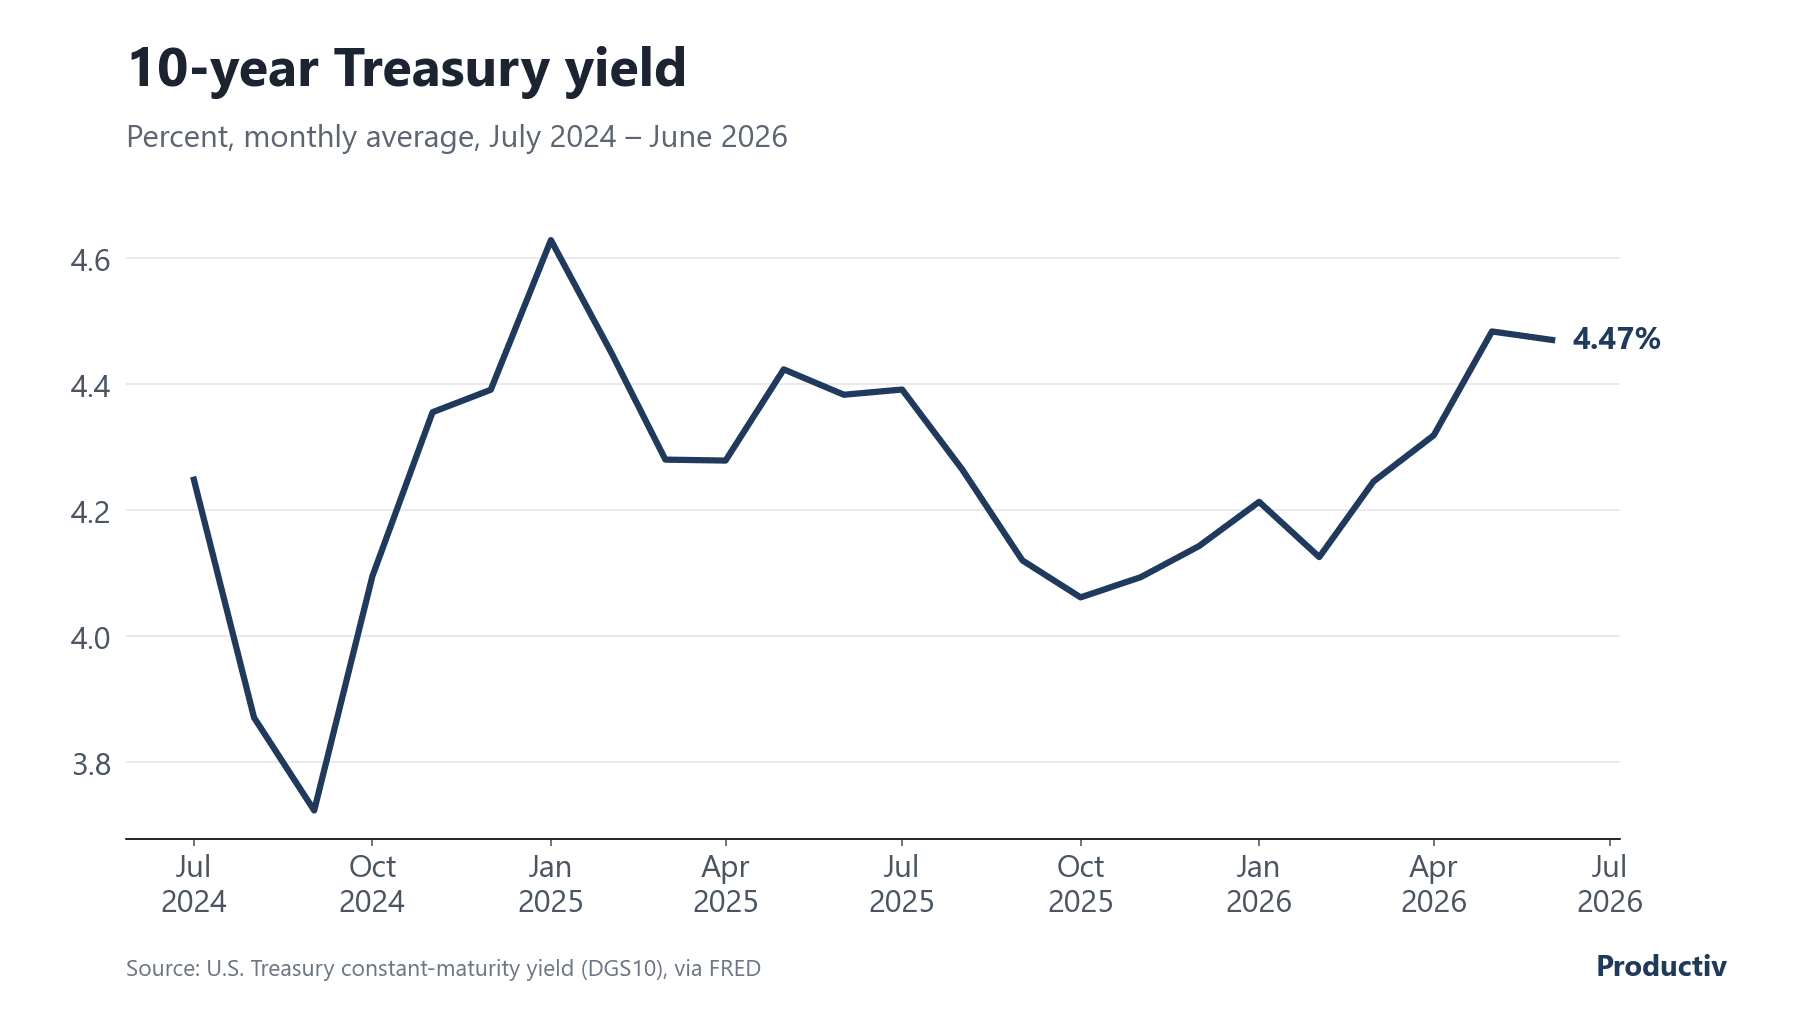
Data table and CSV: getproductiv.com/data/labor-logistics-indicators/2026-08/r4-10-year-treasury.csv
Chart data (table)
| Month | 10-year Treasury |
|---|---|
| July 2024 | 4.25% |
| Aug. 2024 | 3.87% |
| Sept. 2024 | 3.72% |
| Oct. 2024 | 4.10% |
| Nov. 2024 | 4.36% |
| Dec. 2024 | 4.39% |
| Jan. 2025 | 4.63% |
| Feb. 2025 | 4.45% |
| March 2025 | 4.28% |
| April 2025 | 4.28% |
| May 2025 | 4.42% |
| June 2025 | 4.38% |
| July 2025 | 4.39% |
| Aug. 2025 | 4.26% |
| Sept. 2025 | 4.12% |
| Oct. 2025 | 4.06% |
| Nov. 2025 | 4.09% |
| Dec. 2025 | 4.14% |
| Jan. 2026 | 4.21% |
| Feb. 2026 | 4.13% |
| March 2026 | 4.25% |
| April 2026 | 4.32% |
| May 2026 | 4.48% |
| June 2026 | 4.47% |
Sources: BLS (CES, CPI, PPI, JOLTS), EIA and the Federal Reserve, via FRED. Each chart has its data table and a CSV; the index CSV holds the full history with every component. How the index is built: methodology. All issues: Labor & Logistics Indicators.