Data as of 10 October 2026.
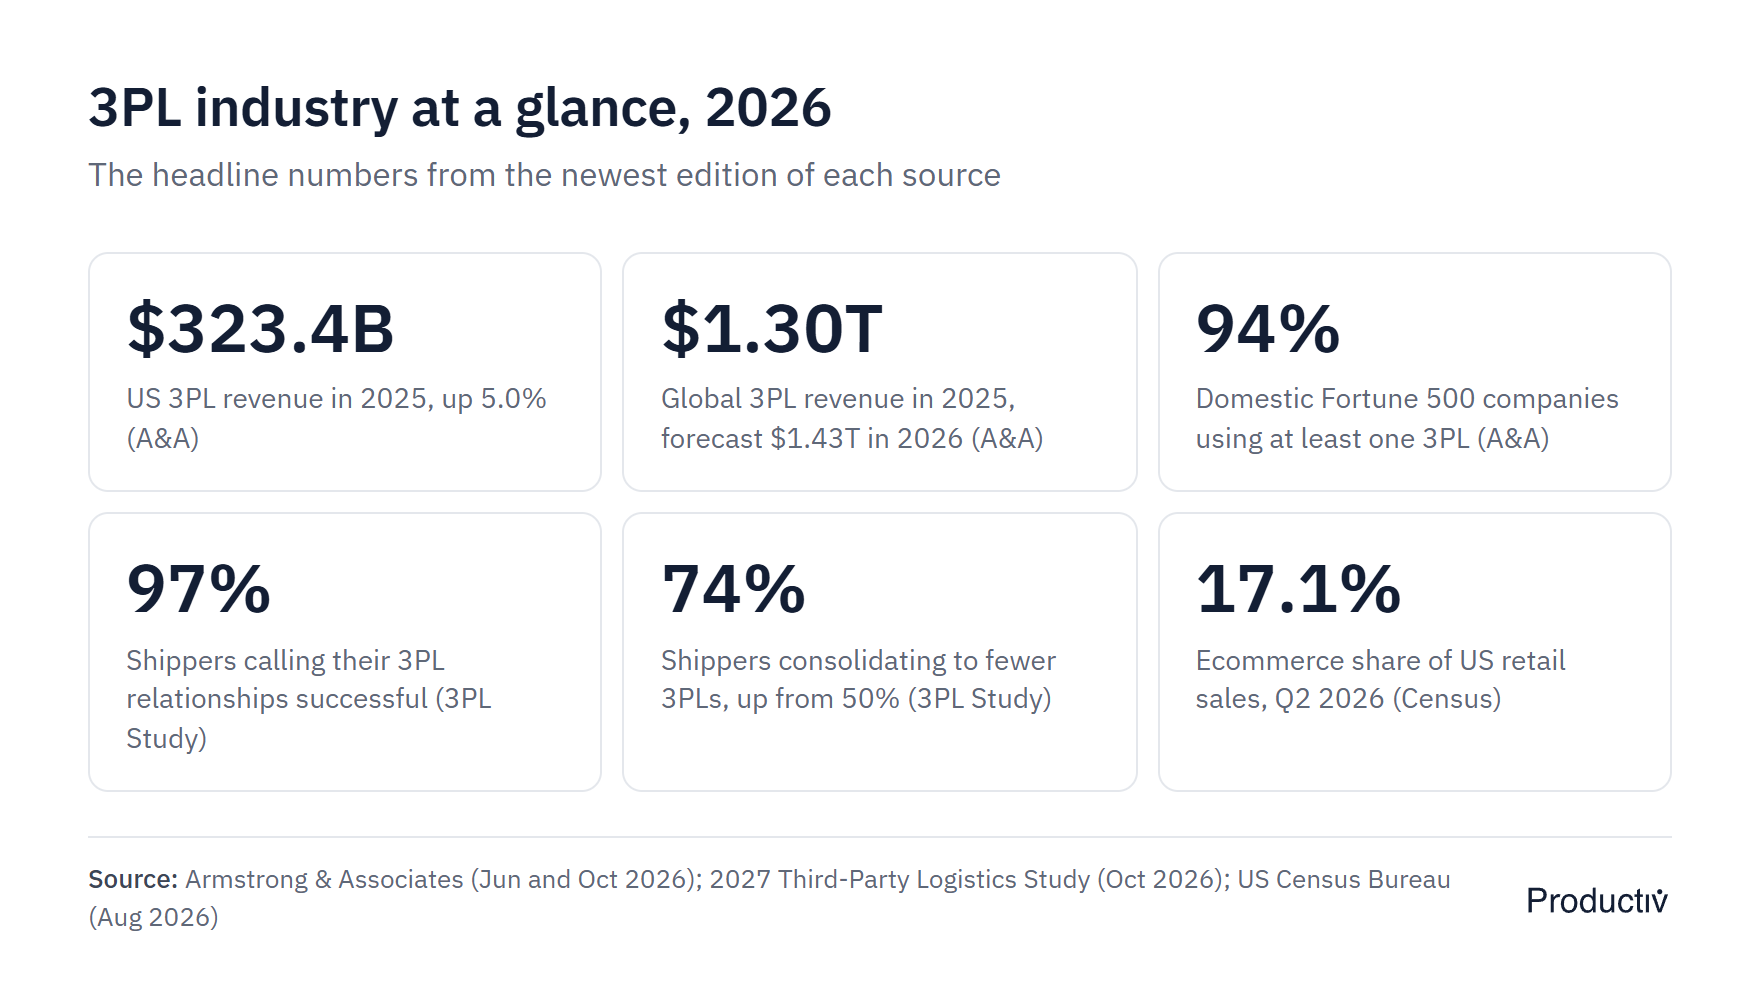
The 3PL industry took in $323.4 billion in the US and $1.3 trillion worldwide in 2025, and 94% of domestic Fortune 500 companies now work with at least one 3PL. These are the newest 3PL statistics available in October 2026, drawn from Armstrong & Associates, the 2027 Third-Party Logistics Study, the Census Bureau, the BLS and other primary sources, with 20 charts on market size, shippers, ecommerce, warehouse space, labor, costs and technology.
Key 3PL statistics for 2026

- US 3PL revenue grew 5.0% to $323.4 billion in 2025, and global 3PL revenue grew 5.3% to $1.30 trillion, with $1.43 trillion forecast for 2026.
- 97% of shippers call their 3PL relationships successful, 86% are increasing their use of outsourced logistics, and 74% are consolidating to fewer providers.
- Only 52% of shippers say 3PLs reduced their logistics costs, down from 75% a year earlier, while 93% say 3PLs improved service to their customers.
- Ecommerce reached 17.1% of US retail sales in Q2 2026, and shoppers now expect a free delivery to arrive within 2.6 days, down from 3.5 days in 2025.
- Warehouse space is tightening again: the Logistics Managers' Index capacity reading fell to 39.3 in September 2026, and warehousing producer prices are up 5.4% on a year earlier.
- 93% of shippers weigh a 3PL's AI capability when choosing a provider, but only 12% of 3PLs describe themselves as highly prepared to deliver AI-enabled operations.
3PL market size: US and global
Armstrong & Associates (A&A) puts US 3PL gross revenue at $323.4 billion in 2025, up 5.0% after 2.8% growth in 2024. Net revenue, which strips out the transportation a 3PL buys from carriers, grew 5.1% to $138.2 billion. A&A counts revenue across the four services a third-party logistics provider sells: domestic transportation management, international transportation management, dedicated contract carriage, and value-added warehousing and distribution.

The market peaked at $405.5 billion in 2022, when freight rates were at their highest, then fell 26.1% in 2023 as rates came back down. The 2025 figure sits 20% below that peak but 52% above 2019's $212.8 billion.
| Year | US 3PL gross revenue | Growth | US 3PL net revenue |
|---|---|---|---|
| 2019 | $212.8B | -0.3% | $91.5B |
| 2020 | $231.5B | +8.8% | n/a |
| 2021 | $342.9B | +48.1% | $119.4B |
| 2022 | $405.5B | +18.3% | $148.1B |
| 2023 | $299.5B | -26.1% | $129.0B |
| 2024 | $307.9B | +2.8% | $131.5B |
| 2025 | $323.4B | +5.0% | $138.2B |
Source: Armstrong & Associates annual US market releases.
US 3PL revenue by segment
Domestic transportation management is the largest segment at $128.3 billion, about 40% of the market. International transportation management grew fastest in 2025, up 7.7% to $85.9 billion. Value-added warehousing and distribution, which covers contract warehousing, fulfillment and the value-added work done inside the building, reached $72.7 billion.

Global 3PL market size
Global 3PL revenue grew 5.3% to $1,300.6 billion in 2025, according to A&A's global report released on 9 October 2026. That is 10.04% of the $12,957 billion the world spent on logistics, almost exactly the 2019 share (10.03%) and well below the 12.93% peak of 2022. A&A forecasts growth of 10.1% to $1,431.6 billion in 2026 and 6.9% to $1,529.7 billion in 2027.

Asia Pacific is the largest region at $487.5 billion, and the US and Greater China together hold 48.3% of global 3PL revenue. The US outsources more of its logistics than other large markets: 3PLs capture 12.71% of US logistics costs, against 7.04% in India.
3PL market forecasts compared
Research firms publish very different numbers for the same market because each defines it differently. A&A's figure is measured revenue; the others are modeled estimates with forecasts attached.

| Publisher | 2025 global 3PL market | Forecast | Growth rate |
|---|---|---|---|
| Armstrong & Associates | $1,300.6B (measured) | $1,529.7B in 2027 | 10.1% in 2026, 6.9% in 2027 |
| Grand View Research | $1,261.0B | $2,502.2B in 2033 | 9.1% a year |
| Precedence Research | $1.29T | $2.74T in 2035 | 7.82% a year |
| Fortune Business Insights | $1,238.7B | $2,852.5B in 2034 | 9.7% a year |
| Mordor Intelligence | $1.15T | $1.57T in 2031 | 5.27% a year |
| Global Market Insights | $1.6T | $4.3T in 2035 | 10.1% a year |
How many 3PL companies are there in the US?
No government agency counts 3PLs directly, because the industry has no single NAICS code. The two closest categories in BLS establishment data both grew through the last decade:
- Warehousing and storage (NAICS 493): 23,345 private establishments in 2025, up 45% from 16,083 in 2014, employing 1.90 million people.
- Freight transportation arrangement (NAICS 488510): 24,835 establishments in 2025, covering freight brokers, forwarders and logistics arrangers, with 260,059 employees.
- IBISWorld's 3PL count: 70,879 US 3PL businesses in 2026, up 0.5% from 2025, using a broader definition that includes many small operators.
- Freight brokers: FMCSA data show roughly 25,000 entities holding active freight broker authority as of May 2026.

The count is large, but revenue is concentrated: A&A's Top 50 global 3PLs earned $602.0 billion in 2025, 46.3% of the global market.
Largest 3PL companies in 2026
Amazon tops both of A&A's 2026 rankings because A&A counts its third-party seller services segment, which it estimates comes mostly from 3PL services such as fulfillment. DSV moved to second place globally after closing its acquisition of DB Schenker on 30 April 2025, and GXO entered the global top 10.
| Rank | Largest global 3PLs | 2025 revenue | Largest US-based 3PLs | 2025 revenue |
|---|---|---|---|---|
| 1 | Amazon (seller services) | $172.2B | Amazon (seller services) | $172.2B |
| 2 | DSV | $37.4B | C.H. Robinson | $14.8B |
| 3 | DHL Supply Chain & Global Forwarding | $35.5B | GXO Logistics | $13.2B |
| 4 | Kuehne + Nagel | $33.8B | J.B. Hunt Transport Services | $11.3B |
| 5 | CEVA Logistics | $18.3B | Expeditors | $11.1B |
| 6 | Nippon Express | $17.2B | UPS Supply Chain Solutions | $8.8B |
| 7 | Maersk Logistics | $15.1B | Kuehne + Nagel (North America) | $8.4B |
| 8 | C.H. Robinson | $14.8B | Ryder Supply Chain Solutions | $7.8B |
| 9 | Sinotrans | $13.6B | Total Quality Logistics | $7.4B |
| 10 | GXO Logistics | $13.2B | DSV (North America) | $7.3B |
Source: Armstrong & Associates, Top 50 Global 3PLs and Top 50 US 3PLs, 2026 editions, ranked by 2025 gross logistics revenue.
By warehouse space, the largest 3PLs are Amazon (426 million sq ft), DHL (264 million) and GXO (221 million). A&A's Top 25 warehousing 3PLs run 2,869 million sq ft between them.
3PL mergers and acquisitions
Deal-making is picking up again after two slower years. Capstone Partners counted 48 3PL transactions in the first half of 2026, up 20%, including 23 private equity deals. Buyers paid an average of 12.0x EBITDA for companies with largely 3PL operations between 2019 and mid-2025, more than double the 5.5x paid for trucking companies.

What percentage of companies use a 3PL?
Nearly every large company uses one. 94% of domestic Fortune 500 companies work with at least one 3PL, up from 46% in 2001, according to Armstrong & Associates, and the heaviest users spread their work across dozens: Volkswagen uses 74 distinct 3PLs and Walmart 72.

The 2027 Third-Party Logistics Study, the 31st annual edition from NTT DATA, Penske Logistics and the University of Tennessee, was published on 6 October 2026. Its outsourcing numbers:
- 86% of shippers are increasing their use of outsourced logistics services, up from 81%.
- 78% of shippers' freight and transportation spend, and 59% of their warehousing spend, goes to outsourced logistics services.
- 62% of total logistics spend went to outsourced services among shippers using 3PLs, in the previous (2026) edition.
- 74% of shippers are consolidating the number of 3PLs they use, up from 50%.
Which logistics services shippers outsource
The most recent edition of the study to break out individual services is the 2024 study. Warehousing became the most outsourced service that year, and the share of shippers outsourcing labeling, packaging, assembly and kitting rose from 17% to 23%.
| Service | Shippers outsourcing (2024 study) | Previous edition |
|---|---|---|
| Warehousing | 65% | 43% |
| Domestic transportation | 62% | 69% |
| Customs brokerage | 53% | 51% |
| International transportation | 51% | 52% |
| Transportation planning and management | 49% | 42% |
| Freight forwarding | 49% | 60% |
| Reverse logistics | 34% | 29% |
| Order management and fulfillment | 23% | 17% |
| Labeling, packaging, assembly and kitting | 23% | 17% |
| Inventory management | 17% | 15% |
On the provider side, Inbound Logistics' 2026 3PL market research found that 77% of 3PLs offer fulfillment, 74% offer value-added services and 70% offer ecommerce warehousing. Demand is strong: 84% of 3PLs grew sales in their latest period, 62% by 10% or more, and 77% added customers.
Shipper satisfaction and why brands switch 3PLs
Shipper satisfaction is at its highest in the study's recent editions. In the 2027 study, 97% call their 3PL relationships successful, up from 88% a year earlier, and 93% say 3PLs improved service to their customers.

The cost story moved the other way. Only 52% of shippers now say 3PLs reduced their overall logistics costs, down 23 points in a year, and 71% say they are highly affected by freight cost volatility. Two gaps between what 3PLs think and what shippers report stand out in the same study:
- Technology: 70% of shippers are satisfied with their 3PL's IT capabilities, while 94% of 3PLs believe their customers are.
- Business reviews: 13% of shippers say quarterly business reviews fully meet both sides' needs, against 46% of 3PLs.
Why 3PL partnerships fail
Poor customer service is the most common reason a 3PL relationship ends. In Inbound Logistics' 2026 survey, 33% of shippers named it as the No. 1 cause of a failed partnership, ahead of failed expectations (29%) and cost (22%). 78% of shippers say service matters more than price when they judge a 3PL.

Most relationships last a long time once they work. The 2026 study found that 85% of shippers' longest 3PL relationship has run more than five years, and 52% of shippers do not rebid their business at the end of every contract. When a relationship does break, the brands that leave big 3PLs often find the provider was built for high-volume, low-variation work rather than kitting, promotions or retail display builds. A switch costs money once, in integration, inventory transfer and ramp-up, while staying with the wrong 3PL costs money every month in chargebacks, fulfillment errors and stockouts.
30M+ Kits Per Year
Turn the Numbers Into a Shortlist
Market data tells you where the industry is. A side-by-side comparison tells you which kind of 3PL fits your channels.
Compare 3PL OptionsEcommerce and omnichannel statistics
US ecommerce sales reached $340.2 billion in Q2 2026, seasonally adjusted, up 12.2% on a year earlier and equal to 17.1% of all retail sales, according to the Census Bureau. That share was 6.9% in early 2015. Online sales across 2025's four quarters added up to about $1.23 trillion.

Holiday and peak season statistics
Peak now runs for weeks rather than days. Adobe counted 25 days in the 2025 holiday season with more than $4 billion in US online spending, up from 18 days in 2024, and forecasts $95.8 billion of online spending in October 2026 alone, up 8%. That moves peak season fulfillment planning forward: labor and space need to be in place by early October.
| Metric | 2025 actual | 2026 forecast |
|---|---|---|
| US online holiday spending (Nov to Dec) | $257.8B (+6.8%) | $275.1B (+6.7%) |
| Cyber Monday | $14.25B | $15.1B |
| Black Friday | $11.8B | $12.9B |
| Cyber Week | $44.2B | $47.5B |
Sources: Adobe 2025 holiday results (7 Jan 2026) and 2026 forecast (28 Sep 2026).
Deloitte expects US holiday ecommerce to grow 7.5% to 8.4% this season, to between $316.1 billion and $318.9 billion for November 2026 to January 2027.
Delivery speed and shipping cost expectations
Shoppers' patience for free delivery dropped sharply in 2026. The AlixPartners Home Delivery Survey found US consumers will now wait at most 2.6 days for a free delivery, down from 3.5 days in 2024 and 2025 and 5.5 days in 2012.

- 94% of consumers say free shipping affects what they buy, and two in three abandon a cart when shipping costs more than about $10.
- 88% say a late delivery affects whether they buy from that retailer again.
- 83% of retail and logistics executives say their cost per package rose over the past year.
- 40% of US shoppers who abandoned a checkout did so because extra costs were too high, and 20% because delivery was too slow, according to Baymard Institute.
Parcel volume statistics
The US shipped 23.1 billion parcels in 2025, up 3.3%, and carrier revenue rose 6.2% to $9.34 per parcel, according to the Pitney Bowes Parcel Shipping Index. Amazon Logistics became the largest US carrier by volume with 6.9 billion parcels, and smaller regional and last-mile carriers more than doubled their volume (+127%). Pitney Bowes projects about 31 billion parcels by 2031.

Retail compliance and B2B statistics
Omnichannel brands ship to stores as well as homes, and retailers enforce strict delivery windows. Walmart's on-time, in-full program has required 90% on-time and 95% in-full shipments since February 2024, and suppliers that miss an OTIF target pay fines on the non-compliant cases. Retail chargebacks for late, short or mislabeled shipments come straight off the supplier's invoice.
- B2B ecommerce: US B2B ecommerce grew 13% to $2.93 trillion in 2025, according to Digital Commerce 360.
- Subscription boxes: the US subscription box market was worth $10.3 billion in 2025, according to Global Market Insights.
Returns and reverse logistics statistics
US retailers expected $849.9 billion in returns in 2025, or 15.8% of sales, down from 16.9% ($890 billion) in 2024, according to the NRF and Happy Returns. Online purchases come back more often than in-store ones, and nearly half of retailers hand holiday returns to a 3PL.
| Returns statistic | Figure |
|---|---|
| Total US retail returns, 2025 | $849.9B |
| Share of all retail sales returned | 15.8% |
| Share of online sales returned | 19.3% |
| Share of holiday sales retailers expect back | 17% |
| Returns that are fraudulent | 9% |
| Retailers using 3PL partners for holiday returns | 49% |
| Consumers who say free returns are a major purchase factor | 82% |
| Consumers less likely to shop again after a poor return | 71% |
Source: NRF and Happy Returns, 2025 Retail Returns Landscape (15 Oct 2025), the newest edition as of this update.
Returns are growing faster than orders. Narvar saw January 2026 return volumes rise about 11% against holiday order growth of about 6%. For brands that outsource returns processing, 87% of 3PLs charge for it, at an average of $3.56 per return, according to The Fulfillment Advisor's 2026 pricing survey.
Warehouse space statistics: vacancy, rents and 3PL leasing
US industrial vacancy was 6.9% in Q2 2026, down 10 basis points on the quarter, according to Cushman & Wakefield. It climbed from a record low of 2.9% in Q2 2022 to 7.1% through 2025 as new buildings delivered, and it has now started to fall. JLL puts the Q2 2026 rate at 6.8%.

- Rents: the average asking rent is $10.32 per sq ft a year, up 2.9% on a year earlier and up 47% over five years.
- Construction: 305.1 million sq ft is under construction, up 18%, the fourth straight quarterly rise.
- Small spaces: shallow-bay buildings have the lowest vacancy of any size class at 4.8%.
- 3PL demand: 3PLs and manufacturers made up more than 55% of US industrial leasing in the first half of 2026.
3PLs are the biggest takers of large warehouses. They signed 44 of the 100 largest US industrial leases in 2025, up from 28 in 2024, and 30 of the top 100 in the first half of 2026, more than any other type of occupier, according to CBRE.
Warehouse capacity and prices: the Logistics Managers' Index
The Logistics Managers' Index shows space getting harder to find. Its Warehousing Capacity reading fell 14.2 points to 39.3 in September 2026, the fastest contraction since March 2022, while Warehousing Prices held at 73.5. Readings above 50 mean a measure is growing and below 50 mean it is shrinking.

| LMI component, September 2026 | Reading | Change on August |
|---|---|---|
| Overall Logistics Managers' Index | 70.2 | +3.6 |
| Warehousing capacity | 39.3 | -14.2 |
| Warehousing utilization | 64.3 | +4.7 |
| Warehousing prices | 73.5 | -1.5 |
| Inventory levels | 58.9 | +6.1 |
| Inventory costs | 79.9 | +1.3 |
Smaller companies feel the squeeze more: firms with fewer than 1,000 employees reported Warehousing Capacity at 36.0, against 44.1 at larger firms.
Warehouse labor statistics: jobs, wages and turnover
Warehousing and storage employment was 1,831,800 in September 2026, down 21,600 on a year earlier, according to preliminary BLS data. The industry averaged 1,865,700 jobs in 2025, more than double the 834,300 of 2015, and peaked at 1,907,600 in 2022.

Pay keeps rising while headcount drifts lower. Average hourly earnings for production and nonsupervisory warehouse workers were $25.74 in August 2026, up 3.6% on a year earlier according to the BLS, and the 2025 average of $24.77 was 33.5% above 2019's $18.55. Across all warehouse employees, average pay reached $26.83 an hour.

- Median pay for warehouse laborers: $22.06 an hour ($45,880 a year) for hand laborers and material movers in warehousing in May 2025, per BLS occupational data, about 14% above the median for the same job across all industries.
- Turnover: the quits rate in transportation, warehousing and utilities was 1.9% in August 2026, down from a 3.0% average in 2022.
- Peak hiring: transportation and warehousing added 266,500 jobs in Q4 2025, down 12% and the fewest since 2018, according to Challenger, Gray & Christmas. Warehousing and storage alone added only about 14,100 jobs between September and December 2025.
- Labor share of 3PL costs: labor accounts for 33.97% of 3PL revenue and occupancy for 27.89%, the two largest operating costs, according to the same 2026 survey of 500 providers.
Wage growth, quits, job openings, diesel and freight prices all feed the Productiv Labor & Logistics Pressure Index, which stood at 130.4 in August 2026 against a 2015 to 2019 baseline of 100.
Fulfillment and logistics cost statistics
US business logistics costs were $2.4 trillion in 2025, or 7.8% of GDP, according to the CSCMP State of Logistics Report prepared by Kearney. The previous edition put the figure at $2.6 trillion and 8.7% of GDP.
Warehousing itself is getting more expensive. The BLS producer price index for general warehousing and storage rose 5.4% in the year to August 2026, after 3.9% in 2025, and is up more than 50% since 2020.

3PL fulfillment pricing benchmarks
The Fulfillment Advisor's 2026 Warehousing and Fulfillment Costs & Pricing Survey of 500 providers gives the average rates 3PLs charge. The biggest change is in minimums: the average monthly minimum rose 45.5% to $752.08, which puts small brands under more pressure than the per-unit rates suggest.
| Fulfillment fee (2026 survey average) | Rate |
|---|---|
| Receiving, per pallet | $8.75 |
| Storage, per pallet per month | $19.37 |
| B2C pick and pack, per one-item order | $3.21 |
| Each additional item | $0.48 |
| B2B pick and pack, per order | $4.86 |
| Returns processing, per return | $3.56 |
| Account setup fee (charged by 55% of providers) | $373.06 |
| Monthly minimum | $752.08 |
| Kitting, per hour (2025 survey) | $43.30 |
| Average annual price increase | 3.68% |
Kitting is quoted per component, per finished kit or per labor hour, and kitting and assembly costs run from about $0.50 to more than $15 per kit depending on the SKUs per kit, the assembly steps and the packaging. The pricing survey put average order picking accuracy at 99.41%, one of the 3PL KPIs brands use to compare providers, and average 3PL profit margin at 13.03%, up from 9.27% in 2025.
Shipping rates and fuel
| Carrier cost | Change |
|---|---|
| UPS general rate increase, 2026 | 5.9% average |
| FedEx general rate increase, 2026 | 5.9% average |
| FedEx general rate increase, from 4 Jan 2027 | 5.9% average |
| USPS peak surcharge, 4 Oct 2026 to 17 Jan 2027 | 6% average |
| US diesel, week of 5 Oct 2026 | $6.199 per gallon |
Sources: Supply Chain Dive reporting the UPS and FedEx 2026, FedEx 2027 and USPS peak announcements; EIA for diesel.
Diesel at $6.199 a gallon is $2.49, or about 67%, above a year earlier, and it flows straight into fuel surcharges on every parcel and truckload.
Technology, automation and AI statistics
AI has become a selection criterion for 3PLs. In the 2027 Third-Party Logistics Study, 93% of shippers call a 3PL's AI capability important, very important or critical when evaluating providers, and 60% call it very important or critical. Only 12% of 3PLs describe themselves as highly prepared to deliver AI-enabled operations; 82% say they are moderately prepared.

The question has sharpened since the 2025 edition, when 42% of shippers said they were likely or very likely to switch 3PLs over AI capabilities, and 74% once "somewhat likely" was included. The main barriers to scaling AI are data quality (61%), legacy systems and integration (54%) and budget (46%).
Other AI and automation figures from 2026:
- AI disruption: 71% of supply chain leaders say AI is disrupting supply chains, according to the 2026 MHI Annual Industry Report with Deloitte. MHI reports that 88% expect to adopt AI within five years and 73% expect to adopt robotics and automation.
- Agentic AI: Gartner forecasts that 60% of companies using supply chain management software will have adopted agentic AI features by 2030, up from 5% in 2025, with spending rising from under $2 billion to $53 billion.
- AI at scale: only 19% of shippers and 15% of logistics providers use AI at scale, according to Descartes' 10th annual transportation benchmark survey (September 2026).
- 3PL plans: 33.7% of 3PL warehouses plan to implement AI in the coming year, up from 16% two years earlier, according to Extensiv's 2025 benchmark report.
Warehouse robotics statistics
- Robot sales: 117,500 professional service robots for transport and logistics were sold worldwide in 2025, up 21% and 47% of all professional service robots, according to the International Federation of Robotics. About 7,000 full-size humanoid robots were sold for commercial use.
- Robot use: 52% of companies surveyed by Modern Materials Handling use robots in their operations, up from 48%, and 74% say robots met their business goals. Order and case picking is the top planned use (57%).
- Productivity: a peer-reviewed field study of 2.09 million picks, published in The International Journal of Logistics Management, found human-robot collaborative picking cut picking time by up to 33.57%.
- Automation orders: global warehouse automation order intake grew 7% in 2025, and Interact Analysis expects about 6% a year through 2030.
The same shift shows up across the fulfillment technology trends reshaping 3PL operations in 2026: robots are moving from pilots into picking, and AI is moving from planning tools into daily decisions.
Tariffs, trade and nearshoring statistics
Mexico is now the largest source of US goods imports. It supplied $534.9 billion, or 15.7%, of US goods imports in 2025, while China's share fell to 9.0% ($308.4 billion) from 21.6% in 2017, according to Census Bureau and BEA trade data.

- Tariff pull-forward: US goods imports in Q1 2025 were 26.3% higher than a year earlier as companies bought ahead of tariffs, and 86% of executives in Kearney's 2026 Reshoring Index survey built inventory that quarter.
- Sourcing shifts: 75% of those executives moved sourcing from China to other low-cost countries, and only 20% looked at increasing US production. 55% say tariff policy made nearshoring less attractive.
- Container imports: US retail container imports were 25.4 million TEU in 2025, and the NRF Global Port Tracker forecasts 25.8 million TEU for 2026, up 1.4%.
- De minimis: duty-free de minimis treatment ended for all countries on 29 August 2025, after 1.36 billion de minimis shipments entered the US in 2024. CBP collected over $1 billion in duties on 246 million low-value shipments by December 2025 and made the change permanent in June 2026.
- Shipper responses: 74% of shippers have diversified suppliers or sourcing regions and 73% have increased safety stock, according to the 2027 Third-Party Logistics Study.
More safety stock means more pallets stored for longer, one of the ways tariffs reach a brand's supply chain costs well after the duty is paid.
Sustainability statistics
- Emissions: freight transportation and logistics produce 8% to 10% of global greenhouse gas emissions, according to the GLEC Framework from Smart Freight Centre.
- Shipper priorities: 24% of shippers name sustainability and ESG goals as a driver of strategic 3PL partnerships, according to the 2026 Third-Party Logistics Study.
- 3PL services: 60% of 3PLs offer sustainability or green logistics services, up 6 points, per Inbound Logistics.
- Electric trucks: electric trucks reached 9% of global truck sales in 2025, but US electric van sales more than halved to about 6,000, according to the IEA Global EV Outlook 2026.
Right-sized packaging, consolidated shipments and better routing are the 3PL sustainability measures that cut cost and emissions at the same time.
3PL trends for 2026 and 2027, by the numbers
The statistics above point to seven shifts that will shape how brands buy fulfillment over the next 18 months:
- Fewer, deeper 3PL relationships. 74% of shippers are consolidating providers, up from 50%, and 85% have a 3PL relationship older than five years.
- Service over savings. Only 52% of shippers credit 3PLs with lower costs, but 93% credit them with better service, and 78% rank service above price.
- AI as a buying criterion. 93% of shippers weigh AI capability, but only 12% of 3PLs say they are highly prepared, and Gartner expects agentic AI in 60% of supply chain software by 2030.
- Tighter, pricier warehouse space. LMI capacity is at 39.3 with prices at 73.5, the warehousing producer price index is up 5.4%, and 3PL minimums rose 45.5%.
- Longer peaks. 25 days topped $4 billion in online sales in 2025, and October 2026 is forecast at $95.8 billion.
- Faster delivery promises. Shoppers now expect free delivery in 2.6 days, and 88% say a late delivery affects whether they buy again.
- Regional sourcing. Mexico supplies 15.7% of US imports while China's share has fallen to 9.0%, and 73% of shippers carry more safety stock.
The same shifts run through the 3PL trends for 2026, from AI and automation to nearshoring and returns.
Sources
| Source | Publisher | Published |
|---|---|---|
| US 3PL market results and US market size estimates | Armstrong & Associates | Jun 2026 |
| Global 3PL market trends and Top 3PL rankings | Armstrong & Associates | Oct 2026 |
| Trends in 3PL/Customer Relationships | Armstrong & Associates | Apr 2026 |
| 2027 Third-Party Logistics Study | NTT DATA, Penske Logistics, University of Tennessee | Oct 2026 |
| 2026 Perspectives 3PL Market Research Report | Inbound Logistics | Jul 2026 |
| Quarterly Retail E-Commerce Sales | US Census Bureau | Aug 2026 |
| Current Employment Statistics, QCEW, PPI | US Bureau of Labor Statistics | Oct 2026 |
| US Industrial MarketBeat Q2 2026 | Cushman & Wakefield | Jul 2026 |
| Logistics Managers' Index, September 2026 | Logistics Managers' Index | Oct 2026 |
| State of Logistics Report | CSCMP and Kearney | Jun 2026 |
| 2026 Warehousing and Fulfillment Costs & Pricing Survey | The Fulfillment Advisor | Aug 2026 |
| 2025 Retail Returns Landscape | NRF and Happy Returns | Oct 2025 |
| Parcel Shipping Index | Pitney Bowes | 2026 |
| Home Delivery Survey 2026 | AlixPartners | Jun 2026 |
| US International Trade in Goods and Services, 2025 | US Census Bureau and BEA | Feb 2026 |
| 2026 Reshoring Index | Kearney | Jun 2026 |
| World Robotics 2026: Service Robots | International Federation of Robotics | Sep 2026 |
| 3PL Market Update | Capstone Partners | Jun 2026 |
Key Takeaways
- →US 3PL revenue grew 5.0% to $323.4 billion in 2025, and global 3PL revenue grew 5.3% to $1.30 trillion.
- →97% of shippers call their 3PL relationships successful, and 74% are consolidating to fewer 3PLs.
- →Only 52% of shippers say 3PLs cut their logistics costs, down from 75% a year earlier.
- →Warehouse capacity is shrinking again: the LMI capacity reading fell to 39.3 in September 2026.
- →93% of shippers weigh AI when choosing a 3PL, but only 12% of 3PLs call themselves highly prepared.
Frequently Asked Questions
How big is the 3PL industry?
The US 3PL market was worth $323.4 billion in gross revenue in 2025, and the global market $1,300.6 billion, according to Armstrong & Associates. Global revenue is forecast to reach $1,431.6 billion in 2026. Other research firms estimate the 2025 global market at anywhere from $1.15 trillion to $1.6 trillion, depending on how they define it.
Is the 3PL industry growing?
Yes. US 3PL revenue grew 5.0% in 2025 after 2.8% in 2024, and A&A forecasts global growth of 10.1% in 2026. Revenue is still below the 2022 peak of $405.5 billion, which was inflated by record freight rates.
How many 3PL companies are there in the US?
There is no official count, but IBISWorld puts the number of US 3PL businesses at 70,879 in 2026. BLS data show 23,345 warehousing and storage establishments and 24,835 freight transportation arrangement establishments in 2025. Most are small, and the top 50 global 3PLs earn 46.3% of all 3PL revenue.
Who is the largest 3PL in the world?
Amazon is the largest 3PL by revenue on Armstrong & Associates' 2026 list, at $172.2 billion of third-party seller services revenue in 2025. Among traditional logistics companies, DSV ($37.4 billion), DHL Supply Chain & Global Forwarding ($35.5 billion) and Kuehne + Nagel ($33.8 billion) are the largest.
What percentage of companies use a 3PL?
94% of domestic Fortune 500 companies use at least one 3PL, up from 46% in 2001. Among shippers in the 2027 Third-Party Logistics Study, 86% are increasing their use of outsourced logistics, and they outsource 78% of transportation spend and 59% of warehousing spend.
How much does a 3PL cost?
The average 3PL charges $3.21 to pick and pack a one-item ecommerce order, $19.37 per pallet per month for storage and $8.75 per pallet to receive inventory, according to a 2026 survey of 500 providers. The average monthly minimum is $752.08. Kitting, B2B orders and returns are priced separately.
What is the difference between a 3PL and a 4PL?
A 3PL runs logistics operations such as warehousing, fulfillment and transportation, while a 4PL manages a company's whole supply chain, often coordinating several 3PLs. The difference between a 3PL and a 4PL comes down to who owns execution and who owns orchestration. 24% of 3PL warehouses see building a 4PL network as an opportunity, according to Extensiv.
What percentage of shippers are happy with their 3PL?
97% of shippers say their 3PL relationships are successful, up from 88% a year earlier, according to the 2027 Third-Party Logistics Study. Satisfaction with 3PL technology is lower, at 70%, and only 52% say 3PLs reduced their logistics costs.
20 Years of Kitting Excellence
Ready to Streamline Your Supply Chain?
Join industry leaders achieving 99%+ SLA performance with flexible kitting, fulfillment, and 3PL solutions.
Get in Touch